
IB Syllabus focus:
'Understanding how the fragmentation pattern of a compound in the mass spectrometer assists in determining its structure.'
Mass spectrometry is not only an analytical tool to determine the molar mass of a compound, but also a robust method for structural elucidation. The fragmentation pattern of a compound, observed in the mass spectrometer, can offer invaluable insights into its molecular structure.
Mass Spectrometry: An analytical technique that measures the mass-to-charge ratio of ions to determine the molecular mass and structural information of a compound.
What is Fragmentation in Mass Spectrometry?
During ionisation in mass spectrometry, the molecular ion (parent ion) can break apart to produce various smaller ions. This process is termed fragmentation. The pattern in which a molecule fragments and the resulting ions' relative intensities provide a wealth of information about the molecule's structural aspects.
Molecular Ion (Parent Ion): The ion formed when a molecule loses or gains an electron without fragmentation, representing the intact molecule with a single positive charge.
Factors Influencing Fragmentation
Various factors influence how a molecule will fragment in the mass spectrometer:
Bond Strength: Weaker bonds are more likely to break than stronger ones.
Ion Stability: Fragment ions that result in more stable configurations, such as carbocations or resonance-stabilised configurations, are more likely to form.
Molecular Geometry: The spatial arrangement of atoms can influence which bonds are more exposed or more vulnerable to breakage during ionisation.
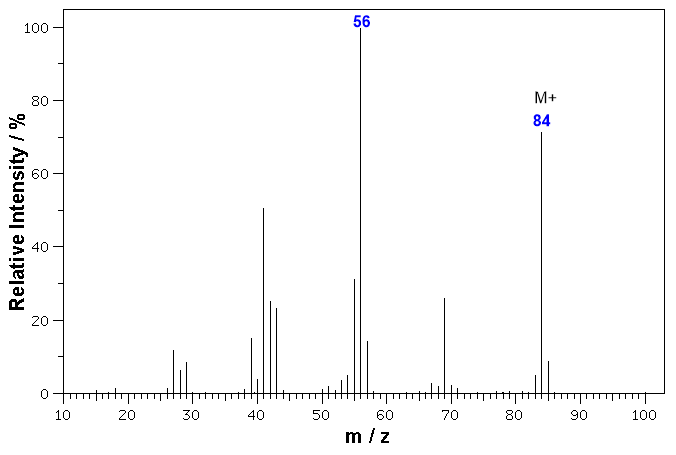
Example graph of Fragmentation patterns in Mass Spectrometry.
Image courtesy of Department of Chemistry
Common Fragmentation Patterns
Different classes of organic compounds tend to have predictable fragmentation patterns. Recognising these patterns can assist chemists in identifying the type of compound being analysed:
Alkanes: Often show a peak corresponding to the loss of a methyl group (15 m/z) or an ethyl group (29 m/z).
Alcohols: Fragmentation often leads to the formation of a peak representing the alkyl group attached to the oxygen.
Esters and Acids: Often show a significant peak corresponding to the loss of a water molecule (18 m/z).
Amines: Characteristic peaks arise from the cleavage of the bond between carbon and nitrogen.
The Role of Fragmentation in Structural Elucidation
Understanding fragmentation patterns is crucial for structural elucidation:
Determining Functional Groups: Certain fragmentation patterns are indicative of specific functional groups. For instance, the presence of a peak at m/z 45 in an ether suggests a -CH2OCH3 fragment.
Identifying Substituent Positions: Fragmentation can help determine the position of substituents in a molecule. For instance, in isomeric compounds, the position of a substituent can lead to differing patterns of cleavage, producing distinct fragment ions.
Chain Length and Branching: The sizes of fragment ions can hint at the length of carbon chains or the presence of branching within the molecule.
Tips for Interpreting Fragmentation Patterns
Base Peak: The most intense peak in the mass spectrum, not always the molecular ion, provides valuable information since it's often derived from the most stable fragment ion
Molecular Ion Peak: This peak gives the molecular weight of the compound.
Neutral Loss: It’s beneficial to look for patterns of neutral loss. Common neutral losses include water (18 m/z), ammonia (17 m/z), or hydrogen (1 m/z).
m/z (Mass-to-Charge Ratio): The quantity obtained by dividing the mass number of an ion by its charge number; the fundamental x-axis unit in a mass spectrum.
Isotope Peaks: Some peaks may arise from isotopic variations, especially if elements like chlorine or bromine are present. Recognising these patterns can give hints about the elements present in the compound.
Mass spectrometry, combined with an understanding of fragmentation patterns, offers a powerful tool for the structural determination of compounds. Whether confirming the synthesis of a particular organic molecule or identifying an unknown substance, fragmentation patterns play a crucial role in elucidating molecular structure in modern chemistry.
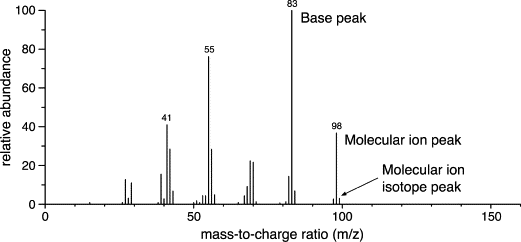
Image courtesy of Eric Stauffer, Julia A. Dolan and Reta Newman
FAQ
The base peak is the tallest peak in a mass spectrum and is assigned a relative intensity of 100%. It represents the most abundant ion or fragment produced during the ionisation process. The prominence of the base peak suggests that this specific fragment is the most stable ion formed under the given conditions. By identifying the m/z value of the base peak, chemists can often deduce crucial information about the structure or certain stable parts of the molecule being analysed.
Some organic compounds, especially those with delicate structures, might undergo extensive fragmentation during the ionisation process in mass spectrometry. This can lead to the molecular ion being short-lived or unstable, causing it to fragment before it can be detected. As a result, the molecular ion peak might be absent or very low in intensity in the mass spectrum. Factors like ionisation energy, technique used, or the compound's inherent stability can influence the visibility of the molecular ion peak.
A peak at m/z 28 in the mass spectrum can be attributed to several fragments, but the most common ones are the nitrogen molecule (N2) and the ethyl cation (C2H4+). In the context of organic compounds undergoing electron ionisation in the mass spectrometer, the appearance of a peak at m/z 28 often suggests the presence of an ethyl group in the molecule. It is crucial for chemists to consider the broader spectral data and other evidence when assigning structural fragments based solely on m/z values.
The molecular ion peak (M+.) represents the molecule's whole positive ion after losing an electron during ionisation. It usually has the highest m/z value among all the peaks in the spectrum, as it corresponds to the compound's molar mass. However, it might not always be the tallest peak. Some molecular ions are less stable and can fragment further, making their peak less intense. By noting the m/z value that matches the molecular weight of the compound (or slightly more than that, accounting for isotope patterns), one can identify the molecular ion peak.
In mass spectrometry, a 'daughter ion' is an ion that results from the fragmentation of a primary molecular ion or parent ion. When the molecular ion (the ionised form of the compound) undergoes further breakdown or fragmentation inside the mass spectrometer, it yields one or more daughter ions. These daughter ions can be detected and provide valuable information about the molecular structure and possible fragmentation pathways of the compound being studied. Analysing the m/z values of these daughter ions helps in understanding the compound's connectivity and functional groups.
Practice Questions
The significant peak at m/z 45 in the mass spectrum is indicative of an ether functional group, specifically the -CH2OCH3 fragment. Ethers tend to fragment in such a way that one of the alkyl groups attached to the oxygen atom is cleaved along with the oxygen, leading to this characteristic peak. Recognising such specific m/z values in the spectrum can assist chemists in deducing the presence of certain functional groups, aiding in the structural elucidation of the compound under analysis.
A predominant peak at m/z 18 in a mass spectrum is typically indicative of the loss of a water molecule. This suggests that the compound might contain a functional group that can readily lose a water molecule during fragmentation. Functional groups like alcohols, esters, and acids are known to show such fragmentation behaviour. Specifically, alcohols can lose an OH group, while esters and acids can lose a water molecule during the ionisation process. Identifying such neutral losses in the mass spectrum provides valuable clues about the presence of specific functional groups in the compound being analysed.
