
IB Syllabus focus:
'Utilizing mass spectra to determine the relative atomic masses of elements from their isotopic composition.
- Interpreting mass spectra in terms of identity and relative abundance of isotopes.
- Noting that operational details of the mass spectrometer will not be assessed.'
In the realm of advanced chemistry, mass spectrometry stands as a quintessential tool for determining the relative atomic masses of elements based on their isotopic composition. The key to this analytical technique lies in understanding and interpreting the mass spectra it produces.
Mass Spectra and Its Significance
Mass spectrometry generates a mass spectrum, which is essentially a plot depicting the intensity of detected ions against their respective mass-to-charge ratio (m/z). This data provides insights into:
Mass-to-charge ratio (m/z): The ratio of the mass of an ion to its charge, used as the horizontal axis in a mass spectrum to identify ions by their mass and charge state.
The identity of the element.
Its isotopic composition.
The relative abundance of each isotope.
By studying the peaks in the mass spectrum, one can deduce valuable information about the sample under investigation.
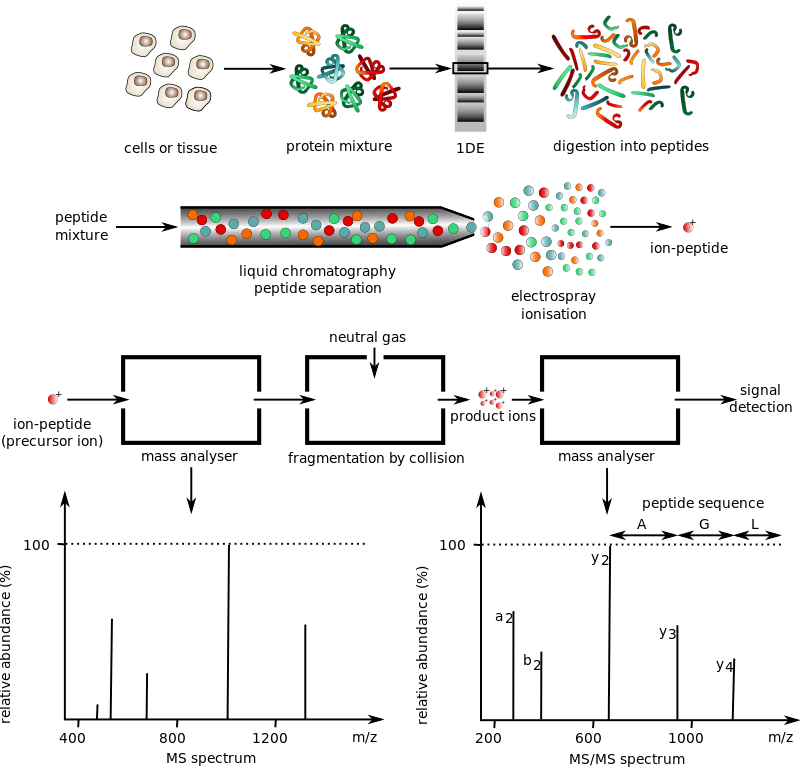
Protocol of mass spectrometry and MS spectrum graph.
Image courtesy of Philippe Hupé
Determining the Relative Atomic Masses from Isotopic Composition
Every element's isotopes will appear as distinct peaks in a mass spectrum. The position (m/z value) of these peaks corresponds to the atomic mass of the respective isotope, while the height or area of the peak indicates its relative abundance.
To calculate the relative atomic mass of an element from its mass spectrum:
Identify Each Isotope's Mass: Look at the m/z value where the peaks appear.
Determine the Relative Abundance of Each Isotope: This is usually given as a percentage or a proportion and can be derived from the height or area of the peaks.
Calculate the Weighted Average: Multiply each isotope's mass by its relative abundance and then sum these values.
Relative Atomic Mass (A_r) = Σ (isotopic mass × fractional abundance)
A_r = The weighted average mass of the naturally occurring isotopes of an element, relative to 1/12 the mass of a carbon-12 atom (no unit).
Isotopic mass = Mass of a specific isotope of the element (atomic mass units, u).
Fractional abundance = Proportion of each isotope present (decimal form, no unit).
Using this weighted average approach gives a more accurate representation of an element's atomic mass when considering all its naturally occurring isotopes.
Interpreting Mass Spectra
When analysing a mass spectrum, the following points should be kept in mind:
Base Peak: This is the tallest peak and represents the most abundant ion.
Molecular Ion Peak (M+): Found furthest to the right, this peak signifies the molecule's original mass before fragmentation.
Isotopic Peaks: These appear due to the presence of different isotopes. For instance, chlorine primarily exists as ^35Cl and ^37Cl, leading to two prominent peaks in a mass spectrum of a chlorine-containing compound.
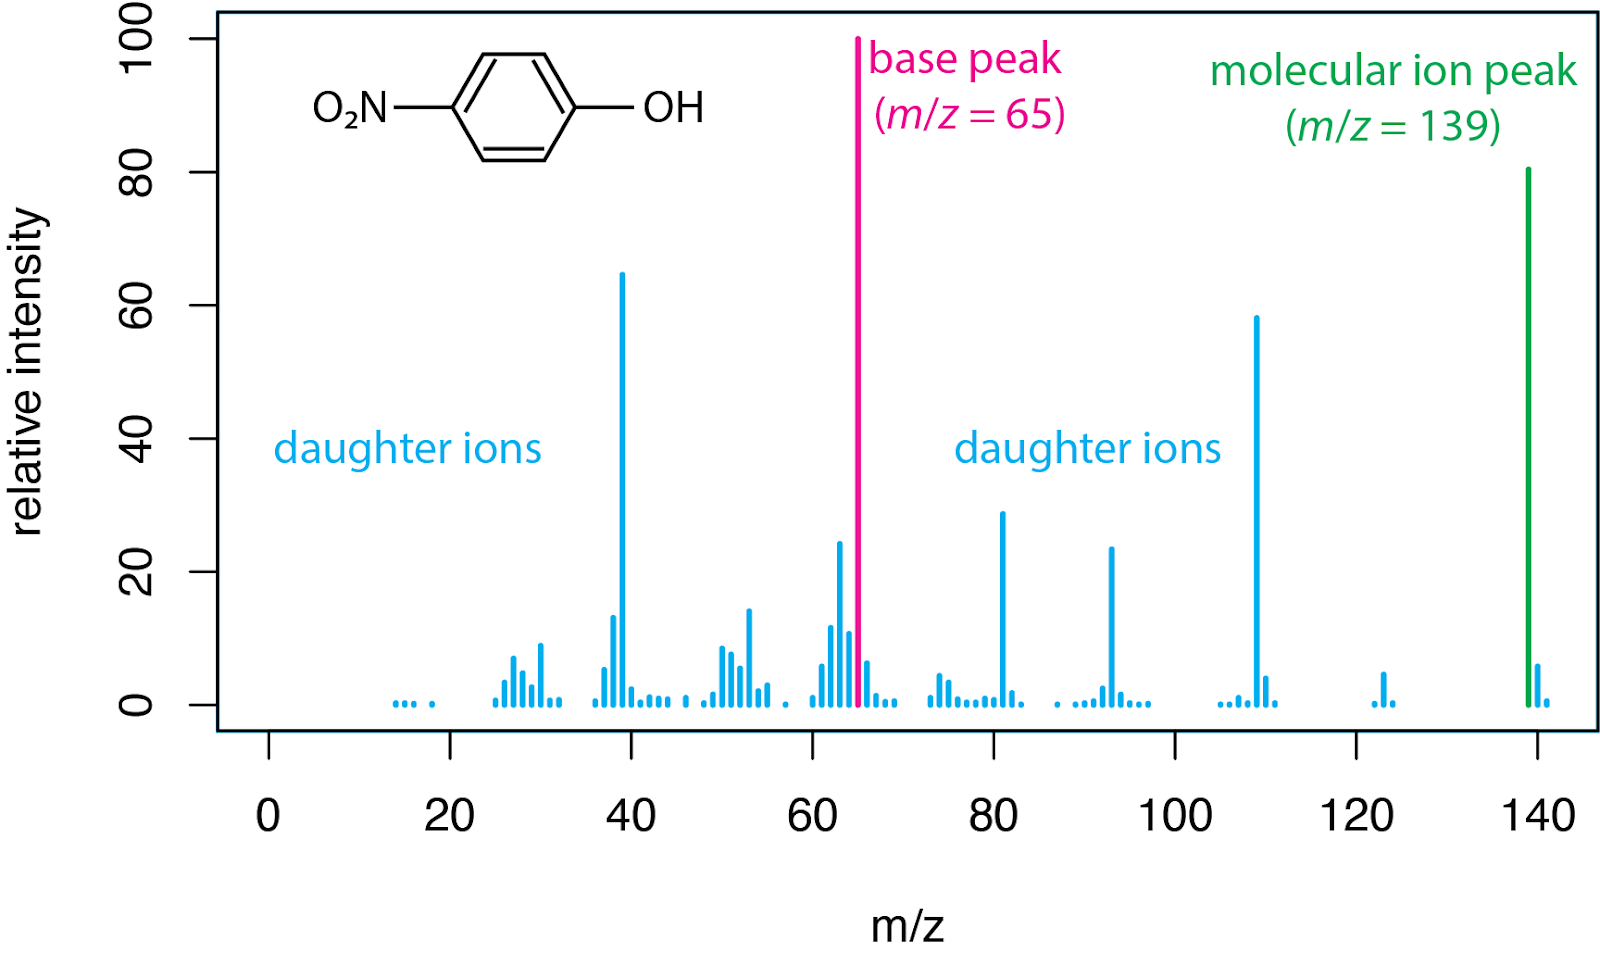
Image courtesy of chem.libretexts.
Understanding the arrangement and relative heights of these peaks allows one to determine not only the element's identity but also its isotopic composition and relative isotopic abundances.
Operational Details of Mass Spectrometer
Though the intricacies of how a mass spectrometer functions might be intriguing, it's pertinent to note that for the purpose of the IB curriculum, the operational details won't be assessed. However, understanding the underlying principles, as discussed above, is crucial.
The mass spectrometer operates on the principle of ionising samples, segregating these ions based on their mass-to-charge ratio, and then detecting and quantifying them. While the nuances of ion sources, detectors, and separators might not be essential for the exams, being familiar with the resultant mass spectra and how to interpret them is paramount.
In conclusion, mass spectrometry, especially in the context of determining isotopic composition, stands as an indispensable tool in modern chemistry. It bridges the gap between the microscopic world of atoms and the macroscopic realm of chemical analysis, enabling us to delve deeper into the secrets of the elements.
FAQ
Traditional mass spectrometry techniques cannot distinguish between enantiomers, as they are isomers that have the same mass and chemical composition but different spatial arrangements. However, advanced techniques, such as chiral mass spectrometry, can differentiate between enantiomers by using chiral agents or by measuring their interaction with circularly polarised radiation. While not commonly used for this purpose, it's an exciting advancement in the field of mass spectrometry.
The area under the peaks in a mass spectrum corresponds to the relative abundance of that particular ion. A larger area indicates a higher concentration of that ion in the sample. By comparing the areas under the peaks, one can determine the proportion of various isotopes or fragments in the sample, providing insights into the sample's composition and isotopic distribution.
Elements can exhibit multiple peaks in their mass spectra due to the presence of isotopes. Isotopes are atoms of the same element with varying numbers of neutrons, leading to different atomic masses. Since mass spectrometry measures the masses of individual atoms or molecules, the distinct isotopes of an element will produce separate peaks, each corresponding to a different isotope.
The m/z value represents the mass-to-charge ratio. It is determined by analysing how ions are deflected by a magnetic field in the mass spectrometer. Ions with a lower m/z value will be deflected more than those with a higher m/z value. By detecting the extent of this deflection, the instrument can calculate the m/z ratio for each ion, which is then represented as a peak on the mass spectrum.
Several ionisation techniques are employed in mass spectrometry. Two of the most common are Electron Impact (EI) and Matrix Assisted Laser Desorption Ionisation (MALDI). EI is a hard ionisation method where a beam of electrons bombards the sample, often leading to fragmentation. It's particularly useful for structural elucidation. MALDI, a soft ionisation technique, uses a laser to ionise samples mixed with a specific matrix, producing primarily intact molecular ions, which is beneficial for analysing large molecules like proteins without causing much fragmentation.
Practice Questions
The relative atomic mass is calculated by taking the weighted average of the isotopic masses and their relative abundances. Using the given data: (68 × 0.60) + (69 × 0.25) + (70 × 0.15) = 40.8 + 17.25 + 10.5 = 68.55 Hence, the relative atomic mass of the element is 68.55.
The base peak in a mass spectrum represents the most abundant ion and serves as a reference point, with its intensity being set at 100%. It is the tallest peak in the spectrum and is not necessarily related to the presence of a particular isotope. On the other hand, the molecular ion peak, often denoted as M+, is found furthest to the right and signifies the molecule's original mass before any fragmentation occurred. This peak provides information about the molecular weight of the compound. In essence, while the base peak gives an indication of ion abundance, the molecular ion peak provides details about the compound's molecular weight.
