
IB Syllabus focus:
'Understanding that emission spectra are produced by atoms emitting photons when electrons in excited states return to lower energy levels.
- Describing the relationship between color, wavelength, frequency, and energy across the electromagnetic spectrum.
- Distinguishing between a continuous and a line spectrum.
- Noting that details of the electromagnetic spectrum are given in the data booklet.
- Discussing how emission spectra provide evidence for the existence of different elements.'
The study of emission spectra offers insights into the intricate dance of electrons within atoms. Let's delve into how atoms emit photons, explore the properties of the electromagnetic spectrum, and discern between different types of spectra.
Emission of Photons by Atoms
Atoms can absorb energy, causing electrons to shift to higher energy levels or excited states.
Excited State: A condition in which an electron has absorbed energy and moved to a higher energy level than its ground state.
When these excited electrons return to their original or lower energy states, they release energy in the form of photons.
This release of photons forms what we observe as emission spectra.
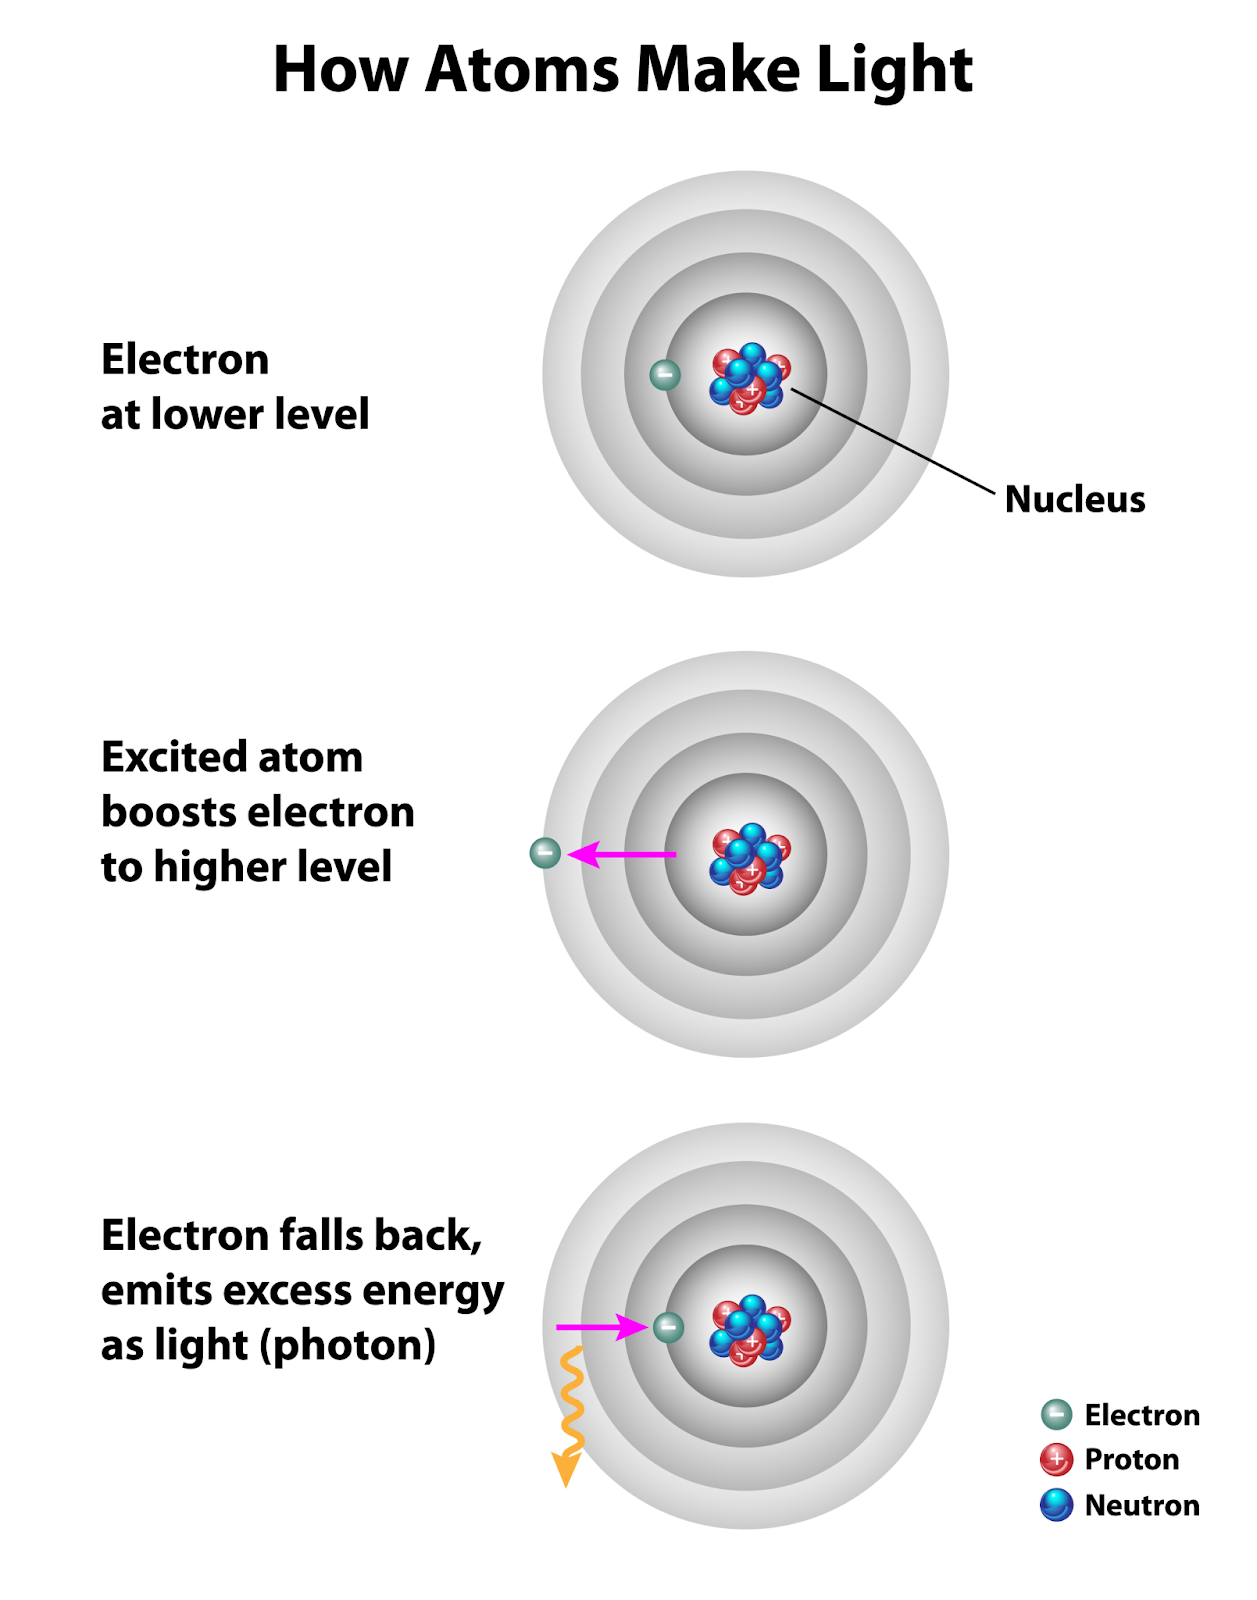
Image courtesy of O Sweet Nature
Electromagnetic Spectrum: Colour, Wavelength, Frequency, and Energy
Wavelength and Frequency
The wavelength (λ) is the distance between two successive crests of a wave.
The frequency (f) denotes how many waves pass a point in a second. It's typically measured in hertz (Hz).
Hertz (Hz): The SI unit of frequency, defined as one cycle (or wave) per second.
Wavelength and frequency have an inverse relationship: as one increases, the other decreases.
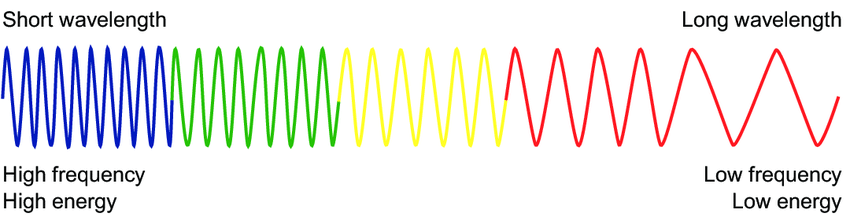
Image courtesy of researchgate.
Energy and Photons
Energy of a Photon (E) = h × f
E = energy of the photon (joules, J)
h = Planck constant (6.63 × 10⁻³⁴ J·s)
f = frequency of the photon (hertz, Hz)
Relation to Colour
Different energies (or frequencies) correspond to different colours in the visible spectrum.
Red light has the longest wavelength and lowest frequency, while violet light has the shortest wavelength and highest frequency.
Wavelength (λ): The distance between two consecutive peaks (or troughs) of a wave, typically measured in metres (m).
Beyond the visible spectrum, we have infrared (lower energy than red) and ultraviolet (higher energy than violet).
Types of Spectra
Continuous Spectrum
A continuous spectrum displays a continuous range of colours without any gaps.
It's produced when white light is dispersed by a prism. You'll see all the colours of the rainbow without any breaks.
Line Spectrum
A line spectrum, on the other hand, shows specific lines of colour on a dark background.
Each line corresponds to a specific energy transition in an atom.
Line Spectrum: A spectrum showing discrete lines of specific wavelengths emitted or absorbed by an element, corresponding to distinct electronic transitions.
The distinct lines indicate the specific energy levels within an atom.
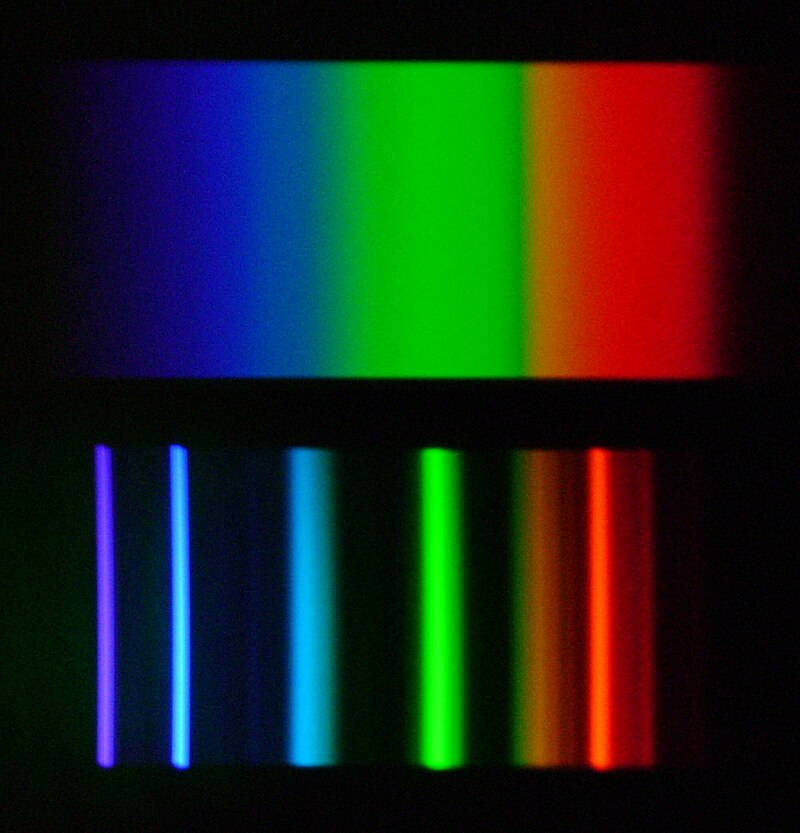
Image courtesy of Horst 123 horst
Electromagnetic Spectrum in the Data Booklet
Detailed information about the electromagnetic spectrum, such as the range of wavelengths, frequencies, and energies for various types of electromagnetic radiation, is provided in the data booklet.
For examination purposes and more detailed analysis, always refer to the data booklet.
Emission Spectra: Evidence for the Existence of Elements
Every element has a unique electron arrangement. When excited, these electrons jump between energy levels and emit photons of specific energies.
Thus, each element produces a unique line spectrum — think of it as an elemental fingerprint.
By studying an emission spectrum, one can identify the presence of specific elements. For instance, the emission spectrum of hydrogen is distinct from that of helium.
Emission Spectrum: The set of wavelengths of light emitted by excited atoms as electrons fall to lower energy levels, unique to each element.
This property has been crucial in fields like astrochemistry, where scientists analyse the light from distant stars to determine their composition.
FAQ
The Planck constant, often denoted by ℎh, plays a fundamental role in quantum mechanics and the study of emission spectra. It links the energy of a photon with its frequency through the equation E=h×f. In the context of emission spectra, it allows scientists to determine the energy of emitted photons by looking at the frequency of the spectral lines. Given that each spectral line in an emission spectrum represents a specific energy transition, understanding the relationship between energy and frequency through the Planck constant is crucial for deciphering the information encoded in emission spectra.
Emission spectra are primarily used to identify individual elements because each element has its unique set of energy levels and thus its unique emission spectrum. However, certain molecular compounds can also produce characteristic emission spectra due to the energy transitions of electrons within the molecules. While these molecular spectra can be more complex and may overlap with the spectra of individual elements, with careful analysis and the use of sophisticated instrumentation, it is indeed possible to use emission spectra to identify certain compounds as well.
The intensity of the lines in an emission spectrum is directly related to the concentration of atoms emitting photons. The brighter or more intense a line appears on the spectrum, the more photons are being emitted at that specific energy, indicating a higher concentration of atoms undergoing that specific energy transition. For instance, if a certain energy transition is very common due to a high concentration of atoms, then the line associated with that transition will be particularly intense on the emission spectrum. Conversely, if only a few atoms undergo a particular energy transition, the corresponding line on the spectrum would be fainter, reflecting the lower concentration.
Emission spectra exhibit discrete lines because electrons in atoms can only occupy specific, quantised energy levels. When electrons transition between these levels, they emit photons with energies corresponding to the difference between the initial and final energy levels. As these energy levels are fixed and distinct, only certain energy transitions are possible, leading to the discrete lines observed in emission spectra. If electrons could exist at any energy level, we'd observe a continuous spectrum, but the quantised nature of electron energy levels in atoms gives rise to the characteristic line spectra we observe.
Not all electrons in an atom emit photons because only electrons that are in an excited state and return to a lower energy level release energy in the form of photons. Electrons in their ground state or those that don't undergo a transition between energy levels don't emit photons. Moreover, for an electron to emit a photon, it must first absorb energy, which often comes from external sources like heat or light. If an atom isn't exposed to such energy sources, its electrons may remain in their ground state and not contribute to the emission spectrum.
Practice Questions
A continuous spectrum displays a seamless range of colours without any interruptions or gaps. It's the type of spectrum you'd observe when white light is dispersed by a prism, showing all the colours of the rainbow continuously. In contrast, a line spectrum consists of specific lines of colour against a dark background. Each line in a line spectrum represents a specific energy transition in an atom. The distinct lines indicate the specific energy levels within the atom. Every element has its unique line spectrum, which serves as a distinctive fingerprint. By studying these line spectra, scientists can identify the presence of specific elements, making them invaluable in fields such as astrochemistry.
Atoms emit photons when their electrons move from a higher energy level to a lower one because the electrons release the excess energy they had acquired. This energy release manifests as photons, and the energy of these emitted photons corresponds to the difference between the two energy levels. The emission spectrum of an element is essentially a graphical representation of these photon emissions. Each distinct line in the emission spectrum corresponds to a specific energy transition within the atom. Since every element has a unique arrangement of electrons and energy levels, the emission spectra are also unique for each element. Thus, by analysing an element's emission spectrum, one can gain insights into its electronic structure and even identify its presence.
