
IB Syllabus focus:
'- Analyze cladograms to deduce evolutionary relationships.
- Understand key terms such as "root," "node," and "terminal branch."'
Cladograms provide an indispensable tool for biologists to visualise and interpret evolutionary relationships between different species or groups. By delving into the intricacies of cladograms, we can deduce these relationships and expand our comprehension of evolutionary processes.
Evolutionary Relationships: The connections among species or groups that reflect their shared ancestry and divergence over time.
What is a Cladogram?
At its core, a cladogram is a diagram that showcases the evolutionary relationships among a set of species or entities. These relationships are based on shared derived characteristics, making it distinct from other evolutionary trees.
Shared Derived Characteristic (Synapomorphy): A trait present in an ancestral species and shared exclusively by its evolutionary descendants, used to determine evolutionary relationships.
Distinguishing Feature: Unlike a phylogenetic tree that portrays the genuine evolutionary history and timeline, a cladogram zeroes in on the relative relationships and shared traits.
Hierarchy of Relationships: The branching nature of a cladogram signifies ancestral relationships and branching events, indicating the evolutionary paths different species have embarked upon.

Image courtesy of Alexei Kouprianov
Integral Components of a Cladogram
To decipher the vast amount of information a cladogram provides, one needs to be familiar with its basic components.
Root
The foundational element of a cladogram.
It symbolises the most recent common ancestor for all entities shown in the cladogram.
Typically situated at the base or the leftmost segment of the diagram, it provides the starting point for analysis.
Node
Each node signifies a pivotal point in evolutionary history.
It represents the most recent common ancestor between two branching groups.
Speciation Event: The process by which one species splits into two or more distinct species, leading to a new branch on a cladogram.
Nodes identify speciation events, providing valuable insights into divergence points in evolutionary history.
Terminal Branch
These are the end points or the extremities of a cladogram.
Each terminal branch embodies the individual organisms, species, or groups under study.
They help in visualising the end results of various evolutionary paths.
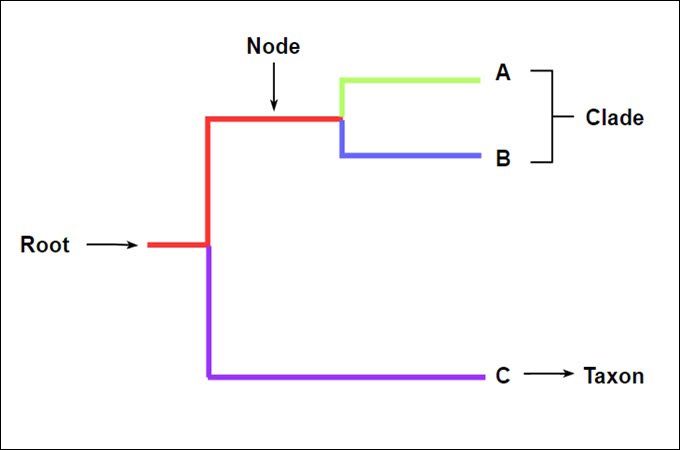
Image courtesy of GitMind
Methodology for Cladogram Analysis
Interpreting the myriad of relationships portrayed by a cladogram necessitates a methodical approach:
Shared Characteristics Identification: The primary step is to pinpoint the shared derived traits (synapomorphies) across different species or groups.
An illustrative example would be the presence of feathers in Species A and Species B, whilst lacking in Species C, signifying a shared trait for A and B.
Spotting Nodes for Evolutionary Milestones: Every node carries significant weight in a cladogram. It is a beacon marking a crucial evolutionary or speciation event.
By meticulously studying these nodes, one can chart out the sequence and nature of evolutionary developments.
Branch Lengths' Implications: In some cladograms, the length of branches can carry significant meaning, representing either evolutionary change or the passage of time.
Nevertheless, it's pivotal to remain cautious as the interpretation of branch lengths hinges on the context and provided data.
Understanding Proximity and Groupings: The positioning of groups on a cladogram isn’t arbitrary. Entities closer together have a more recent shared ancestor compared to ones further apart.
Drawing from the previous example, Species A and B being neighbours on the cladogram implies they share a closer evolutionary history compared to Species C.
Ancestral vs. Derived Traits Differentiation: An essential part of cladogram analysis is distinguishing between traits originating from a common ancestor (ancestral) and ones that evolved post-divergence from the ancestor (derived).
Such derived traits play a critical role in defining different clades or groups.
Leveraging Outgroup Comparisons: An outgroup is purposefully incorporated in a cladogram as a reference point. It's a species or group less closely related to the primary entities under investigation.
This comparison aids in discerning which traits have evolved within the primary group and which ones can be traced back to common ancestors.
Outgroup: A species or group used as a point of reference in a cladogram to help determine which traits are ancestral and which are derived within the primary group being studied.
Mastery Through Practical Engagement
While theoretical knowledge is foundational, mastery is achieved through practice and application:
Iterative Analysis: Embrace a slow, iterative approach when interpreting cladograms. Each examination can reveal deeper insights.
Consistent Practice: Regularly engage with diverse cladograms. Over time, patterns become evident, and interpretation becomes intuitive.
Colour-Coded Study: Colouring different traits or branches can transform a cladogram into a more digestible, visually-appealing study tool.
Knowledge Integration: Always correlate cladogram information with existing biological knowledge. Real-world context can dramatically enhance understanding.
FAQ
Two species might appear morphologically similar due to convergent evolution, where species independently evolve similar traits because they adapt to similar environments or ecological niches, rather than inheriting them from a recent common ancestor. If two species have distant evolutionary histories but have faced similar evolutionary pressures, they might develop similar characteristics. In a cladogram, these species would appear on distant branches because their most recent common ancestor would be quite ancient. Their similarities arise from adaptive solutions to shared challenges, not recent shared ancestry. This distinction between shared traits due to common ancestry versus convergent evolution is a central aspect of cladogram analysis.
In some cladograms, the lengths of branches are arbitrary and hold no specific significance. However, in others, branch lengths can be illustrative, representing the amount of evolutionary change or genetic difference between species. If branch lengths are proportional to the amount of change, longer branches indicate more evolutionary changes compared to shorter ones. It's important to approach cladograms with caution in this regard: if no information is provided about branch lengths, one should not make assumptions about their significance. When analysing a cladogram, it's essential to understand the context and any associated legends or explanations to correctly interpret branch lengths.
Absolutely. As new data emerges, especially with advancements in molecular biology and genomics, our understanding of evolutionary relationships can be refined. Cladograms are constructed based on the best available evidence at a given time. As new species are discovered, or as new genetic data becomes available for existing species, the relationships and groupings in cladograms might be adjusted to reflect this new knowledge. It's also worth noting that different types of data (morphological, molecular, etc.) can sometimes lead to different cladograms, and resolving these discrepancies is an active area of evolutionary biology research.
Outgroups are selected based on their known evolutionary relationships to the in-group (primary group under study). An ideal outgroup is a species or group that is closely related but not part of the in-group. The primary criterion for its selection is that it diverged from the common lineage before the in-group species diverged from each other. Outgroups provide a comparative basis in cladogram analysis. They serve as a reference point to determine which traits are ancestral (present in the common ancestor) and which are derived (evolved in the lineage after divergence). By comparing the in-group to an outgroup, it becomes easier to identify and interpret the evolutionary significance of shared traits.
A cladogram and a phylogenetic tree both visualise evolutionary relationships, but they serve slightly different purposes. A cladogram focuses on the relative relationships among species based on shared derived characteristics without necessarily indicating time or degree of evolutionary change. The emphasis is on grouping species into clades based on shared traits. In contrast, a phylogenetic tree represents the actual evolutionary history and the passage of time. It typically shows the time scale or evolutionary distances, allowing for insights into the evolutionary timelines of species. In essence, while cladograms highlight groupings and relationships, phylogenetic trees provide a broader picture, integrating timelines and evolutionary history.
Practice Questions
Nodes in a cladogram represent the most recent common ancestor between two branching groups, symbolising crucial speciation or evolutionary divergence events. Each node is a point at which a lineage splits, highlighting the historical intersections where two species shared a common ancestry. On the other hand, terminal branches represent the endpoints or tips of a cladogram, portraying the individual organisms or species under investigation. By observing the proximity and arrangement of terminal branches relative to the nodes, one can infer evolutionary relationships and the sequence of divergence. For instance, species on adjacent terminal branches with a shared node have a more recent common ancestor than those separated by multiple nodes.
Ancestral traits are characteristics present in the common ancestor of a group of species and are usually widespread among the descendants. These traits serve as a baseline, reflecting the evolutionary starting point. Derived traits, conversely, are those that evolved in specific lineages after diverging from the common ancestor. They are novel attributes not present in the ancestor but have arisen due to various evolutionary pressures. In cladogram analysis, ancestral traits help identify shared lineages, whilst derived traits assist in differentiating and defining specific clades or groups. The presence or absence of derived traits provides insights into evolutionary branching events and delineates the paths taken by different species post-divergence.
