
Solving equations graphically means finding the points where the graphs of two different functions intersect. These intersection points represent solutions that work for both equations at the same time. This technique combines your knowledge of plotting graphs and interpreting the points where equations meet.
Solving Linear Equations Graphically
Linear equations are written in the form (e.g., ). To solve them graphically:
1. Plot Both Equations
Graph each equation separately on the same axis.
2. Find the Point of Intersection
The coordinates of the point (or points) where the graphs cross represent the solution(s) to the system of equations.
3. Interpret the Solution
The is the solution for , and the is the solution for .
Example 1:
Solve the linear equation graphically:
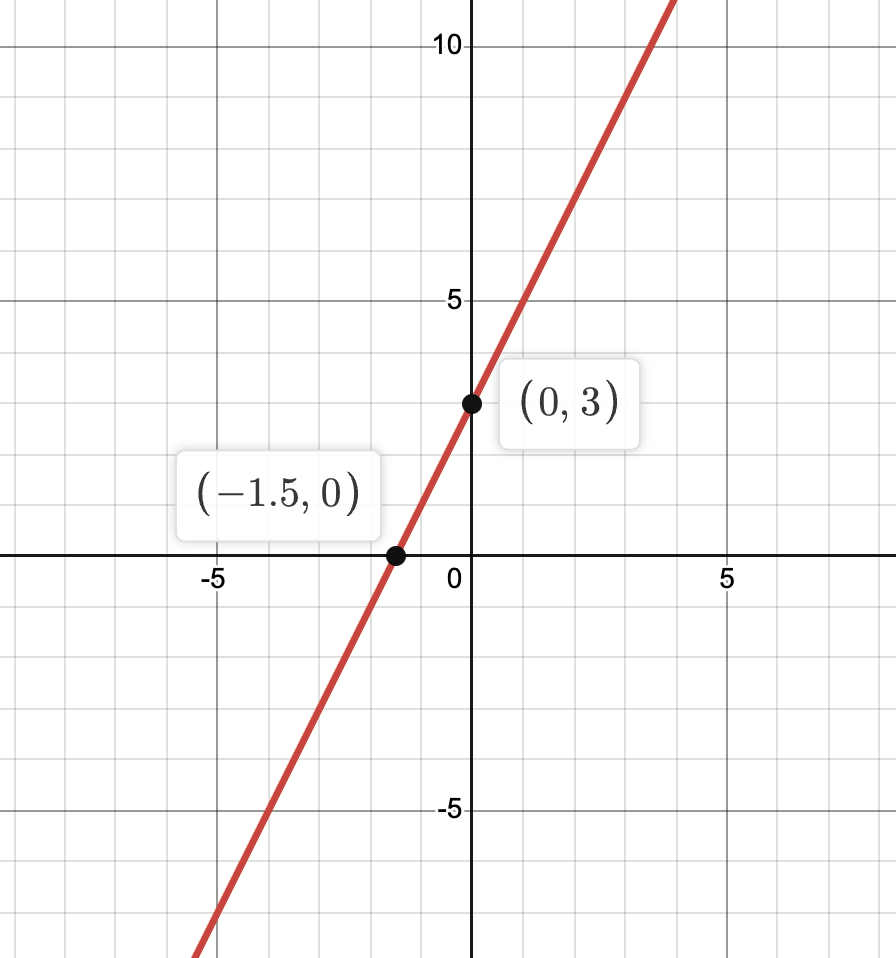
To find the solution to graphically, plot the equation and determine where it intersects the x-axis. The x-coordinate of this point is the solution.
Graphical Solution:
- Plot the line .
- The line intersects the x-axis at the point where .
- To find this point, set and solve for :
- Solve for :
Thus, the line intersects the x-axis at . Therefore, the solution to the equation is .
Example 2
Solve the following system of equations graphically:
Solution:
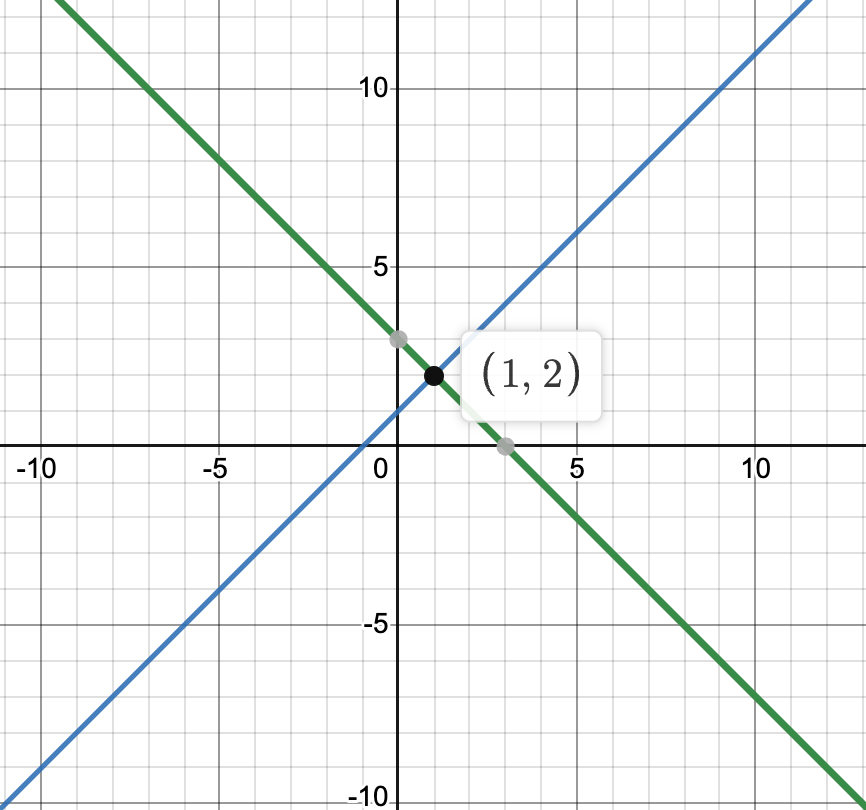
- Step 1: Graph both lines on the same axes.
- Step 2: Identify the intersection point, which in this case is .
- Step 3: The solution is .
Solving Quadratic Equations Graphically
Quadratic equations are written in the form (e.g. ). Here's the graphical method:
1. Plot the Graph
Sketch the quadratic function carefully (consider the y-intercept, turning point, etc.).
2. Graph the Second Equation
This is often a linear equation. Graph it on the same axes.
3. Find Intersections
Look for the points of intersection. These are your solutions.
5. Interpret Roots
The 'roots' of a quadratic equation are the x-values of the intersection points. There might be zero, one, or two roots.
Example 3:
Solve the quadratic equation graphically:
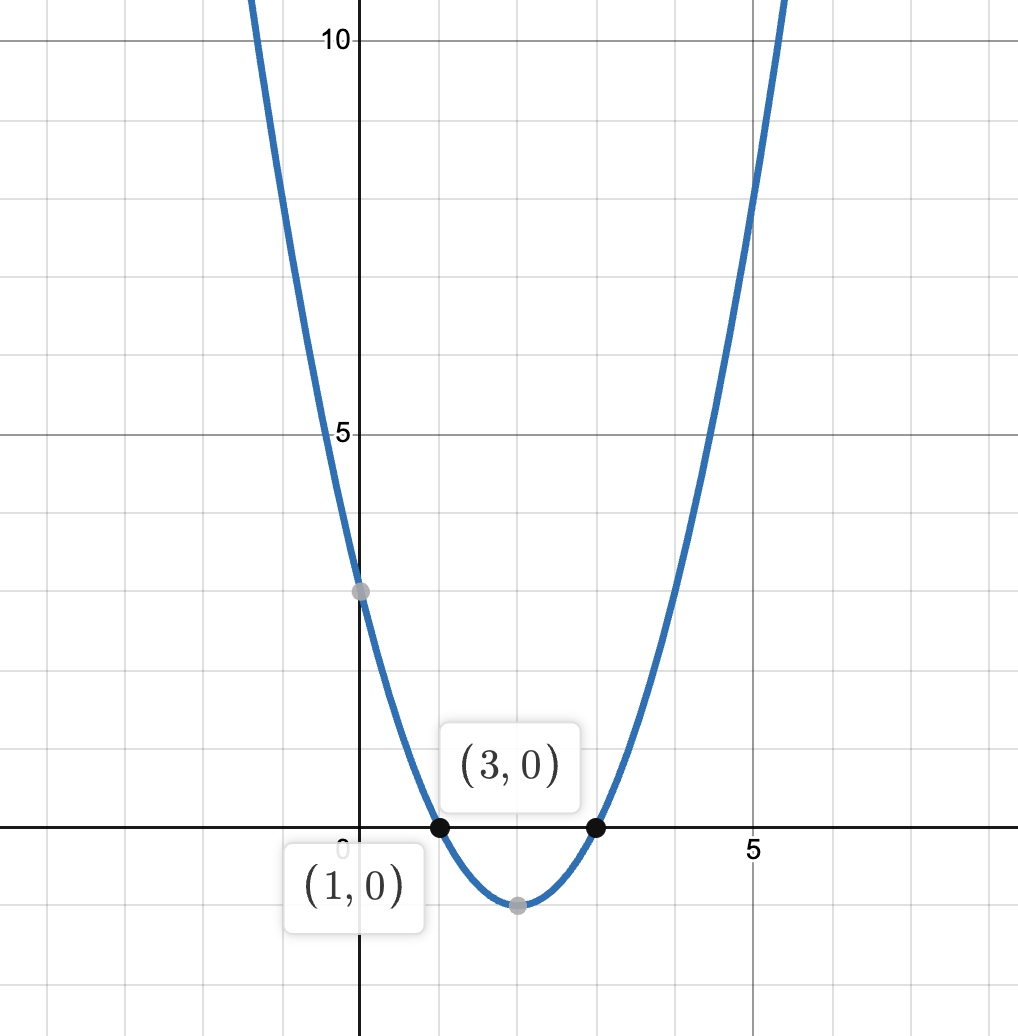
For the quadratic equation , we plotted the corresponding function and identified the x-coordinates of the points where it intersects the x-axis.
- Graphical Solution:
- The parabola intersects the x-axis at two points, which are and . These points are the solutions to the equation , indicating it has two real roots at and .
Example 4
Solve the system of equations graphically:
Solution:
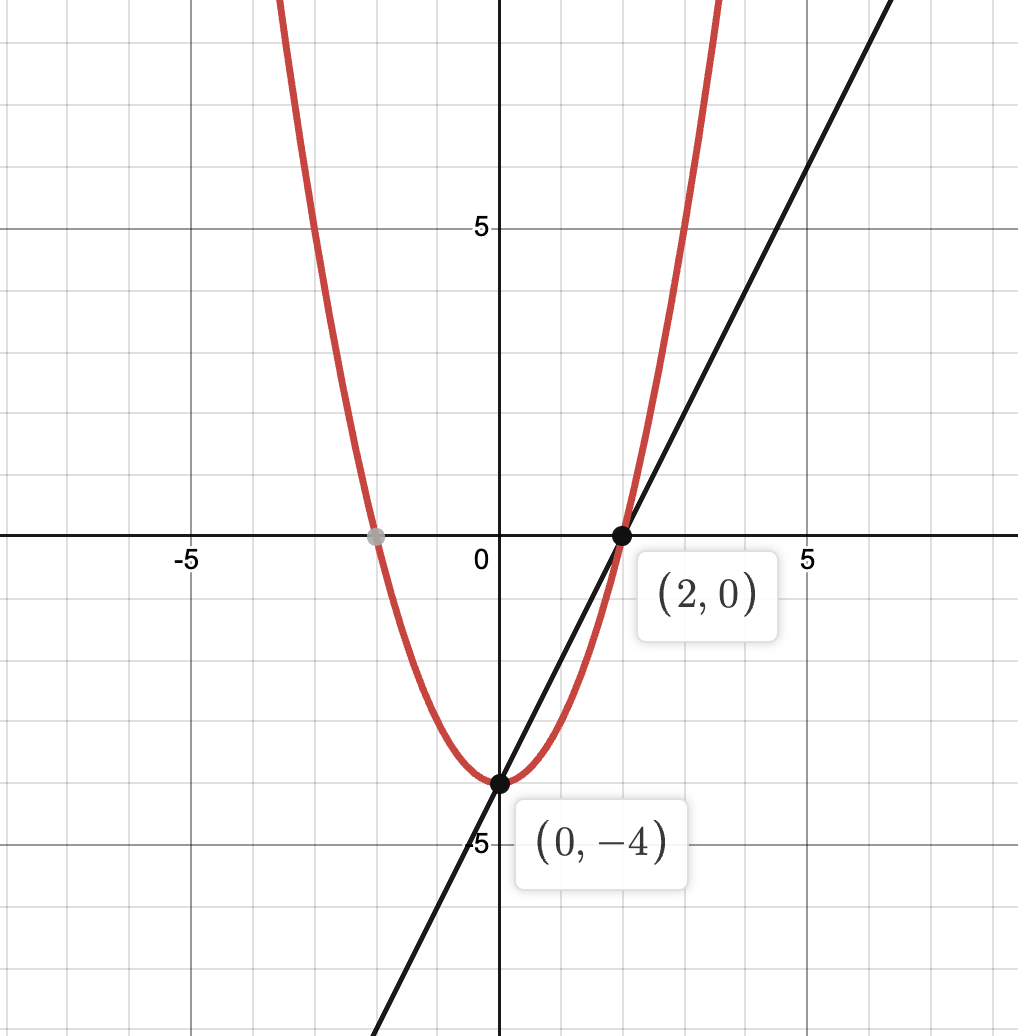
- Step 1: Graph the parabola and the line.
- Step 2: Find the intersections (there are two in this case): and
- Step 3: The roots of the quadratic equation are and .
Solving Equations With More Complex Graphs
Sometimes you need to solve equations involving non-linear functions like reciprocals or trigonometric functions. The same principles apply:
1. Plotting: Graph both equations carefully and accurately.
2. Intersection: Find the point(s) where the graphs cross.
3. Interpretation: The x-value(s) of these intersections are the solutions.
Important Notes:
- Accuracy: Using graph paper and a ruler helps to get accurate solutions.
- Technology: Graphing calculators or dedicated software can simplify the process.
- Real-World Problems: This method is often used to visualize solutions to practical problems.
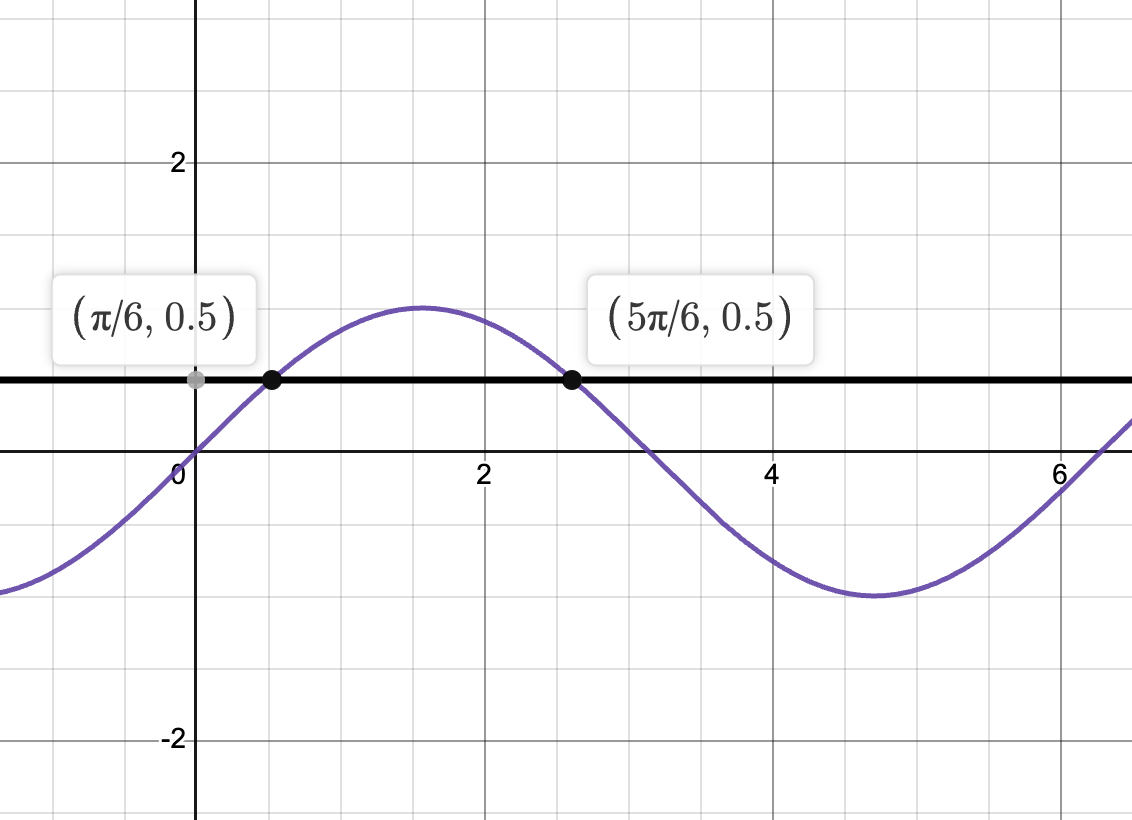
Example 3 (More challenging)
Solve the system of equations graphically:
- (within the domain )
Solution:
- Step 1: Graph the sine wave and the horizontal line .
- Step 2: Find the intersections within the specified domain.
- Step 3: Identify the approximate x-values of the solutions from the graph.
Interpreting Graphical Solutions
Graphical solutions not only allow us to find the roots of equations by identifying the points of intersection with the x-axis but also offer insights into the behavior of functions, such as:
- The number of roots (real solutions) an equation has.
- The nature of the roots (whether they are distinct or repeated).
- The general shape and direction of the function.
