
Graphs are a powerful tool used to visualize the relationship between two variables. In this topic, we will explore how to construct and interpret graphs of various types of functions, including linear functions, quadratic functions, and rational functions.
Constructing Tables of Values
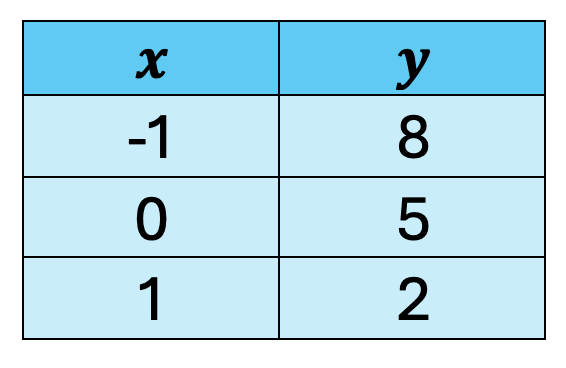
The first step in understanding the behaviour of a function is often to create a table of values. This involves choosing a few input values (x-values) and calculating the corresponding output values (y-values) using the function's equation.
Example 1:
Construct a table of values for the function for
Solution:
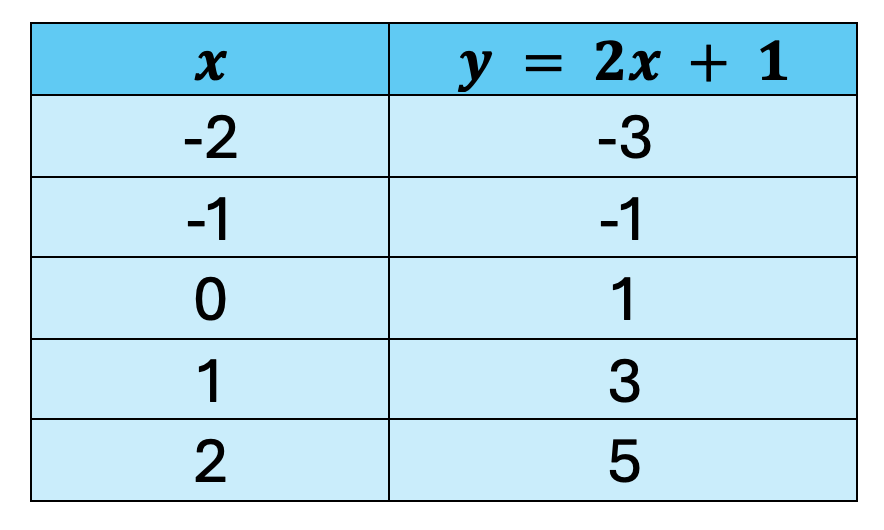
By observing the table, we can see that as the input value increases, the output value also increases. This suggests a positive linear relationship between and .
Drawing Graphs from Tables
Once you have a table of values, you can plot the points on a coordinate plane and connect them with a smooth line to obtain the graph of the function.
Example 2:
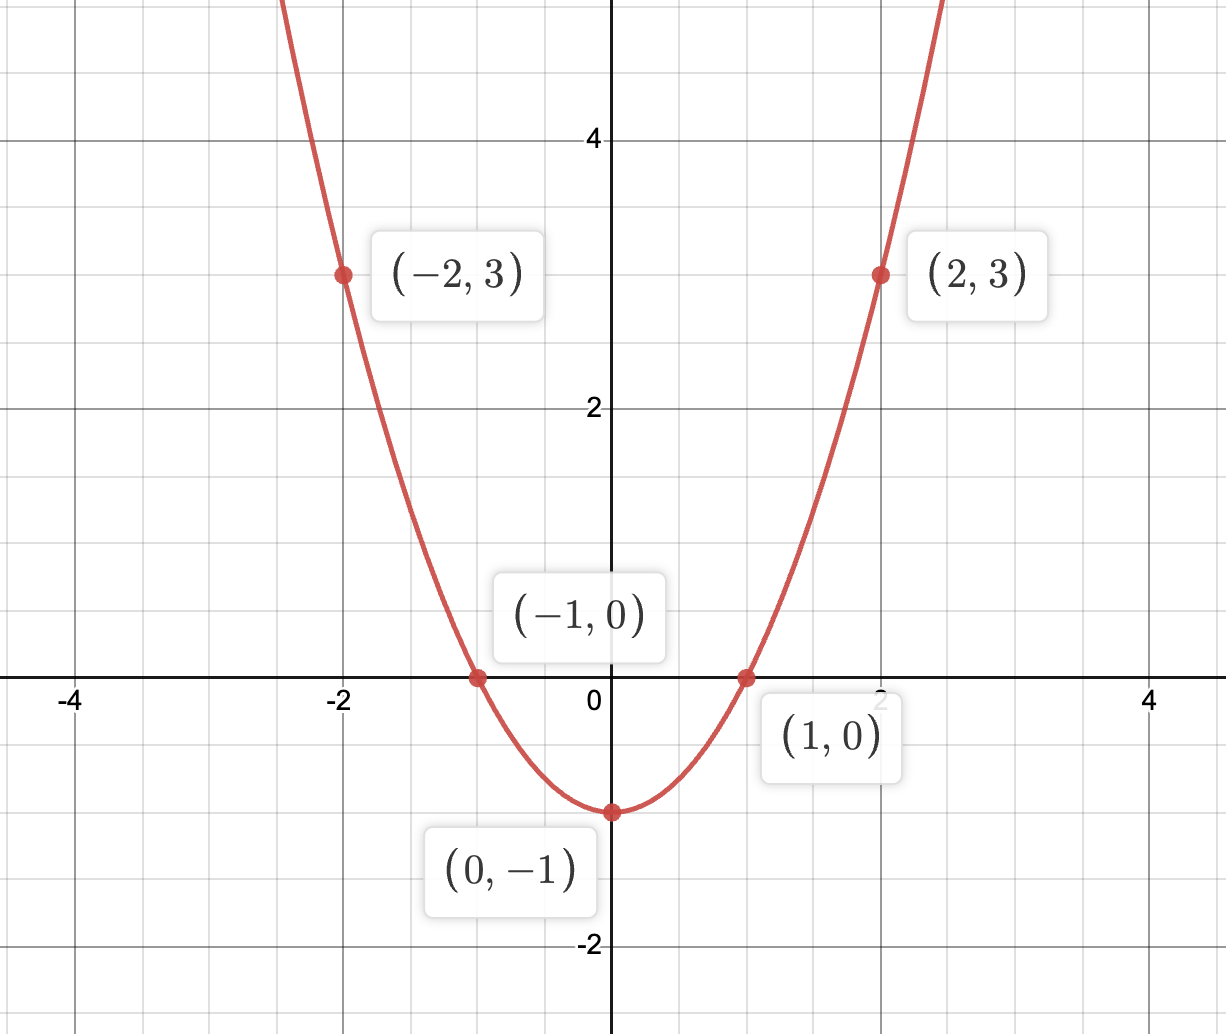
Draw the graph of the function using the following table of values.
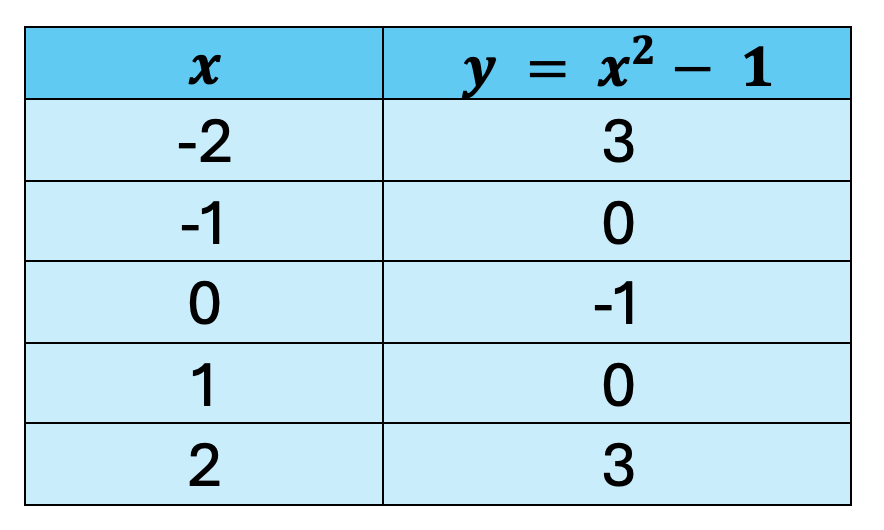
The graph obtained is a parabola, which opens upwards since the leading coefficient is positive.
Recognizing and Interpreting Graphs
By analyzing the shape and features of a graph, we can gain valuable insights about the function it represents.
- Linear graphs: These appear as straight lines, with the slope indicating the rate of change and the y-intercept marking the point where the line crosses the y-axis.
- Quadratic graphs: These are typically U-shaped or inverted U-shaped, depending on the sign of the leading coefficient. The vertex represents the point of minimum (when the leading coefficient is positive) or maximum (when the leading coefficient is negative).
- Rational graphs: These can have various shapes depending on the degree of the numerator and denominator. They may have holes or vertical asymptotes where the function is undefined.
Example 3:
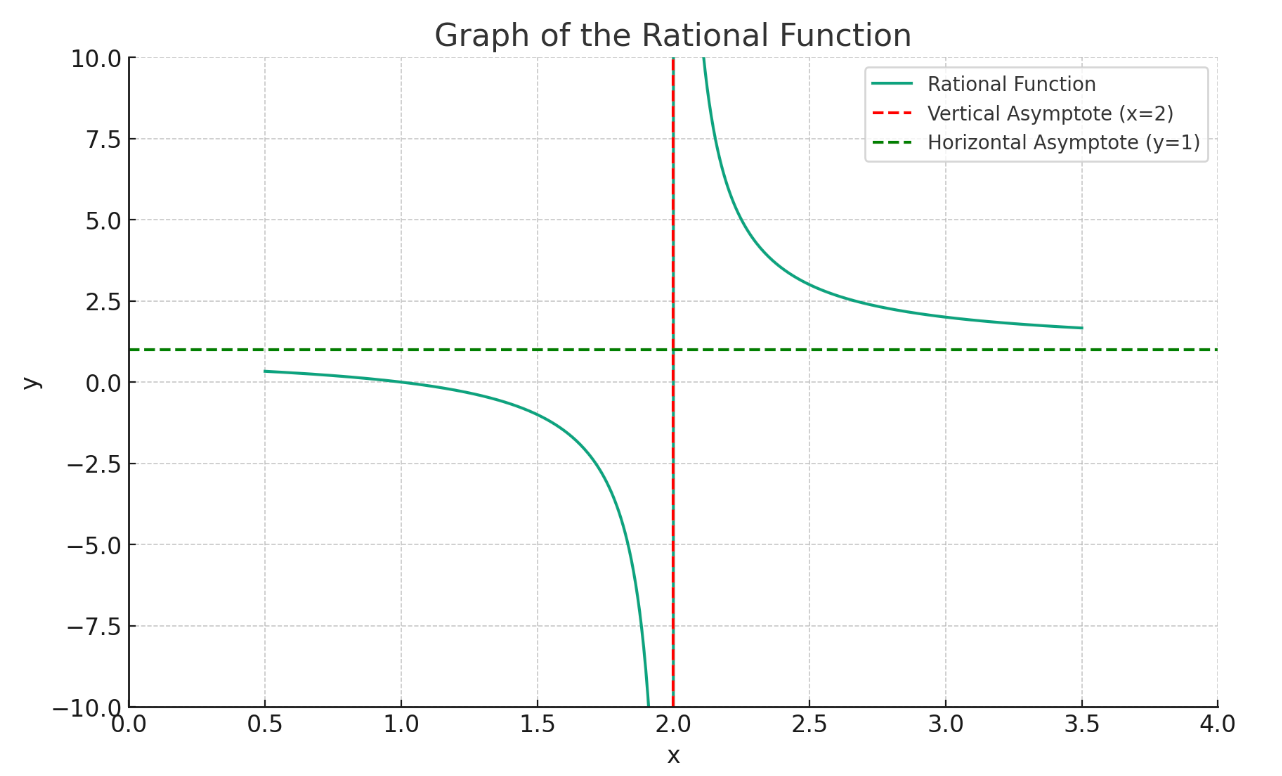
Analyse the graph below and answer the following questions.
a) What type of function does the graph represent?
b) What is the domain and range of the function?
Solution:
a) The graph has a vertical asymptote at and a horizontal asymptote at . This suggests that the function is a rational function of the form , where has a factor of and has a degree less than the degree of .
b) The domain excludes due to the vertical asymptote. The range excludes due to the horizontal asymptote. Therefore, the domain is all real numbers except for 2, and the range is all real numbers except for 1.
Practical Questions
Question 1:
The function is given.
a) Construct a table of values for
b) Draw the graph of the function.
c) What is the of the graph?
Solution:
a)
b)
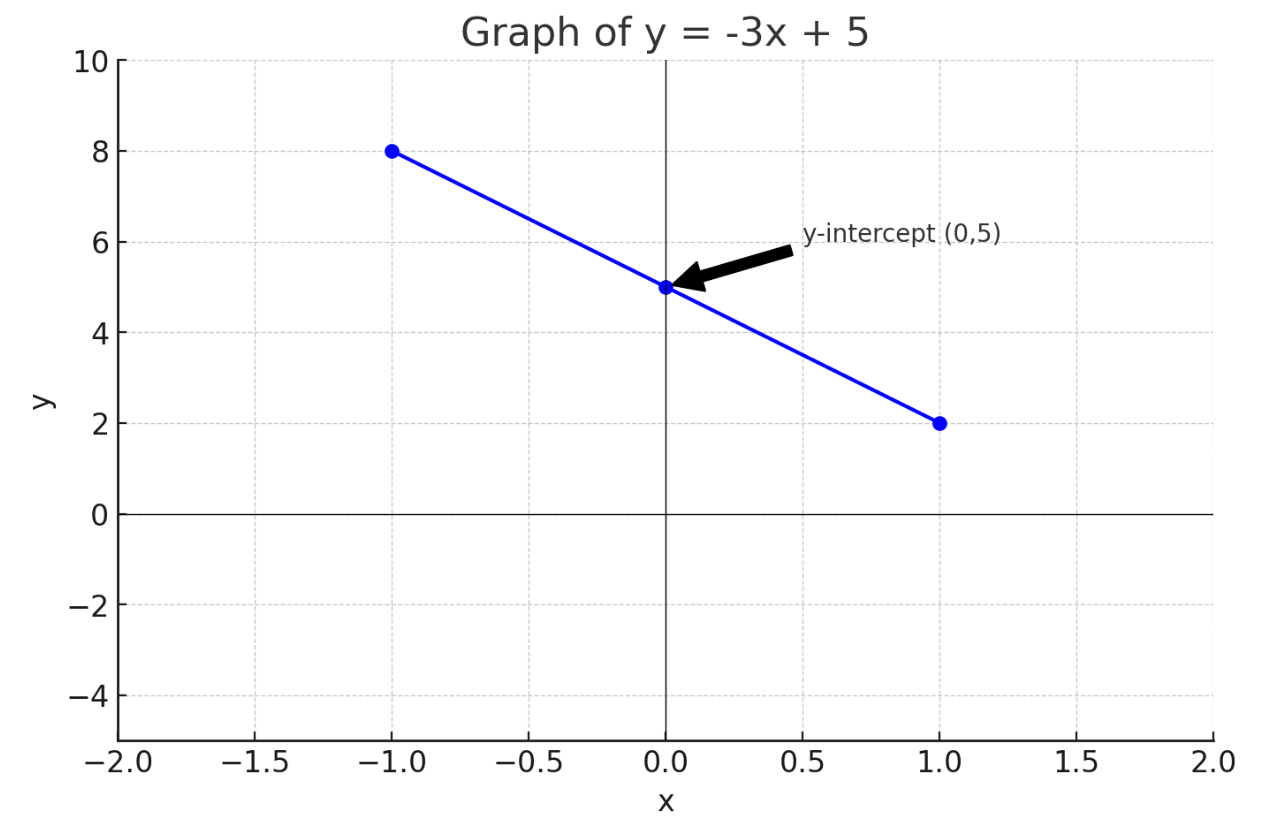
c) The y-intercept is the point where the line crosses the y-axis, which is .
Question 2:
The graph of the function is shown.
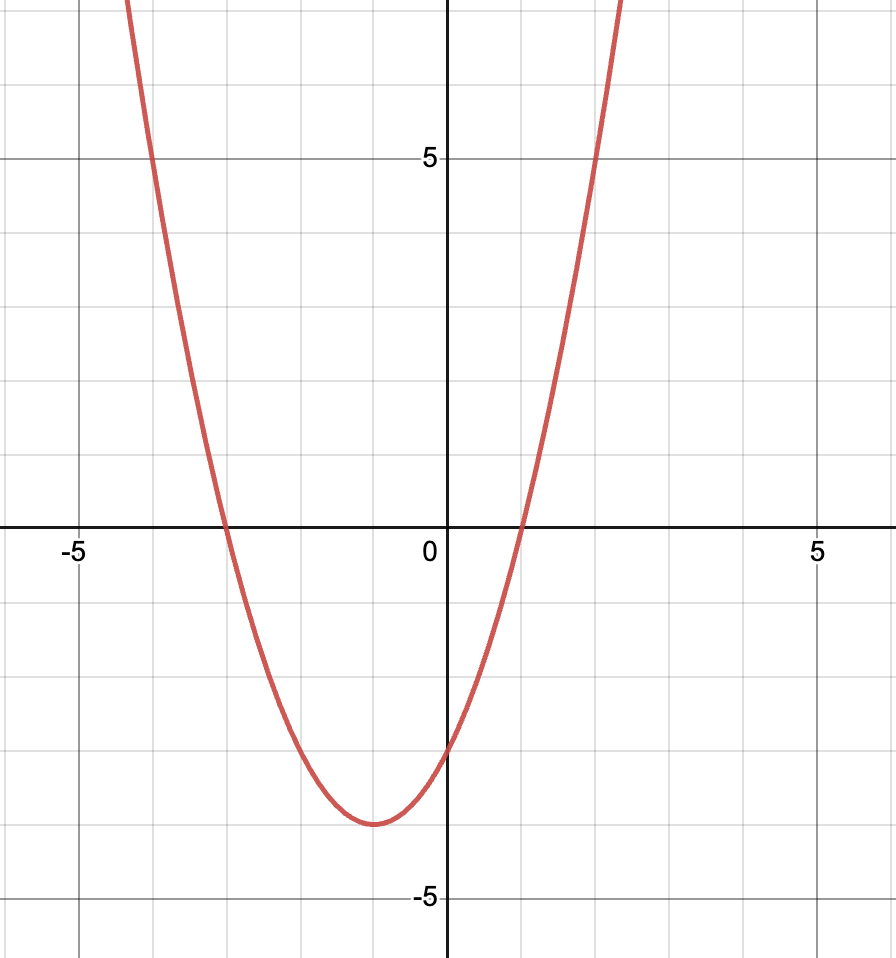
a) Determine the coordinates of the vertex.
While we can estimate the vertex from the graph, a more accurate approach is to use the fact that the x-coordinate of the vertex is given by for a function in the form of . In this case, , , and .
Therefore, the x-coordinate of the vertex is:
To find the , we can substitute this back into the equation:
Therefore, the coordinates of the vertex are .
b) State the domain and range of the function.
The domain of a quadratic function is all real numbers.
The range of a quadratic function with a leading coefficient of a depends on the sign of . Here, is positive. Therefore, the range is all real numbers greater than or equal to the of the vertex, which is .
In conclusion:
- Domain: All real numbers
- Range:
