This section focuses on the essential skills of recognising, sketching, and interpreting the graphs of linear and quadratic functions. It aims to equip students with the ability to visually represent equations and understand their properties such as symmetry and roots.
Recognising Graphs
Linear Functions
Linear functions follow the formula , where represents the gradient and is the y-intercept.
- Gradient (m): Indicates the line's slope. Positive values denote an upward slope, while negative values indicate a downward slope.
- Y-intercept (c): The point at which the line crosses the y-axis.
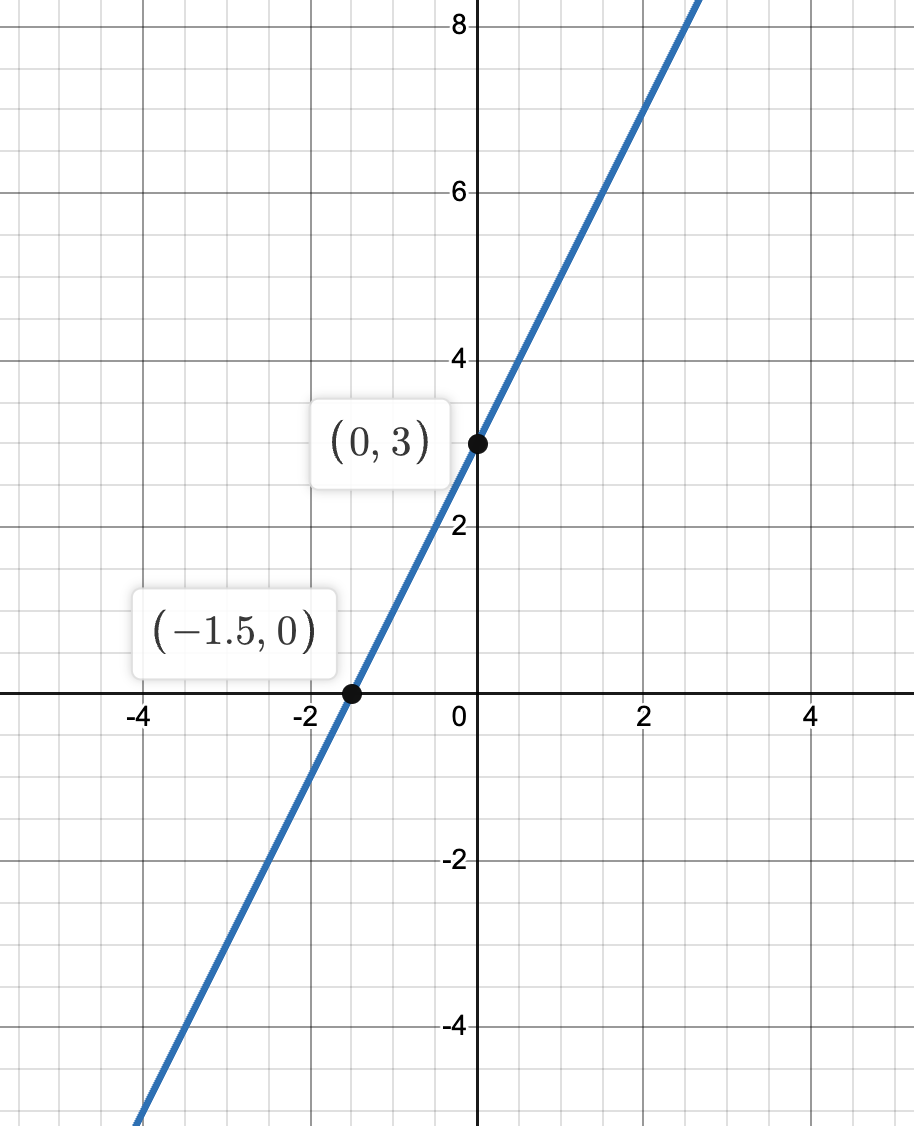
Example: For the equation :
- Gradient : the line slopes upwards.
- Y-intercept : the line crosses the y-axis at .
Quadratic Functions
Quadratic equations are of the form , producing a parabolic curve.
- Symmetry: The graph is symmetrical around its vertex.
- Roots: The x-intercepts, calculated by solving .
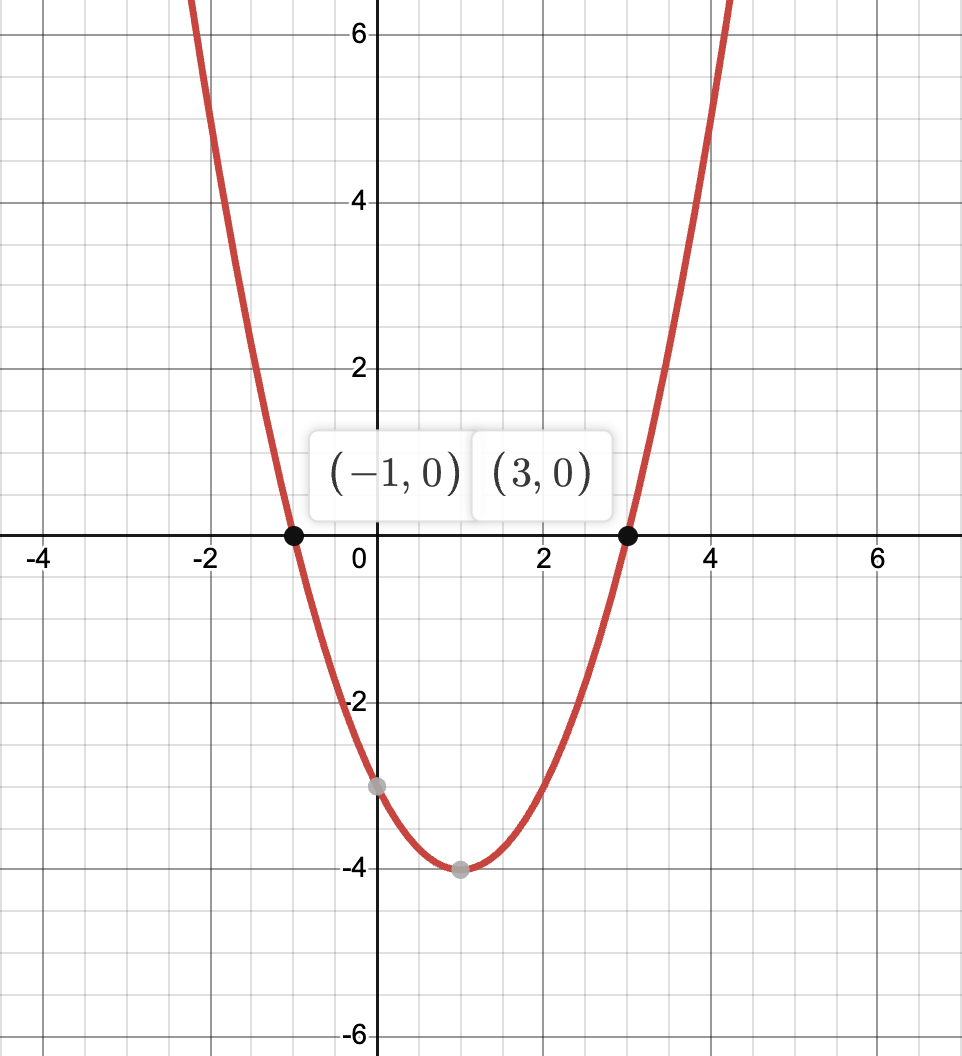
Example: For , to find the roots, solve .
Sketching Graphs
Linear Graphs
To sketch a linear graph, identify the y-intercept and apply the gradient to plot a second point.
Example Calculation for :
- Plot y-intercept: Point .
- Apply gradient: From , move up 2 units vertically for every 1 unit horizontally to find a second point .
- Draw the line connecting these points.
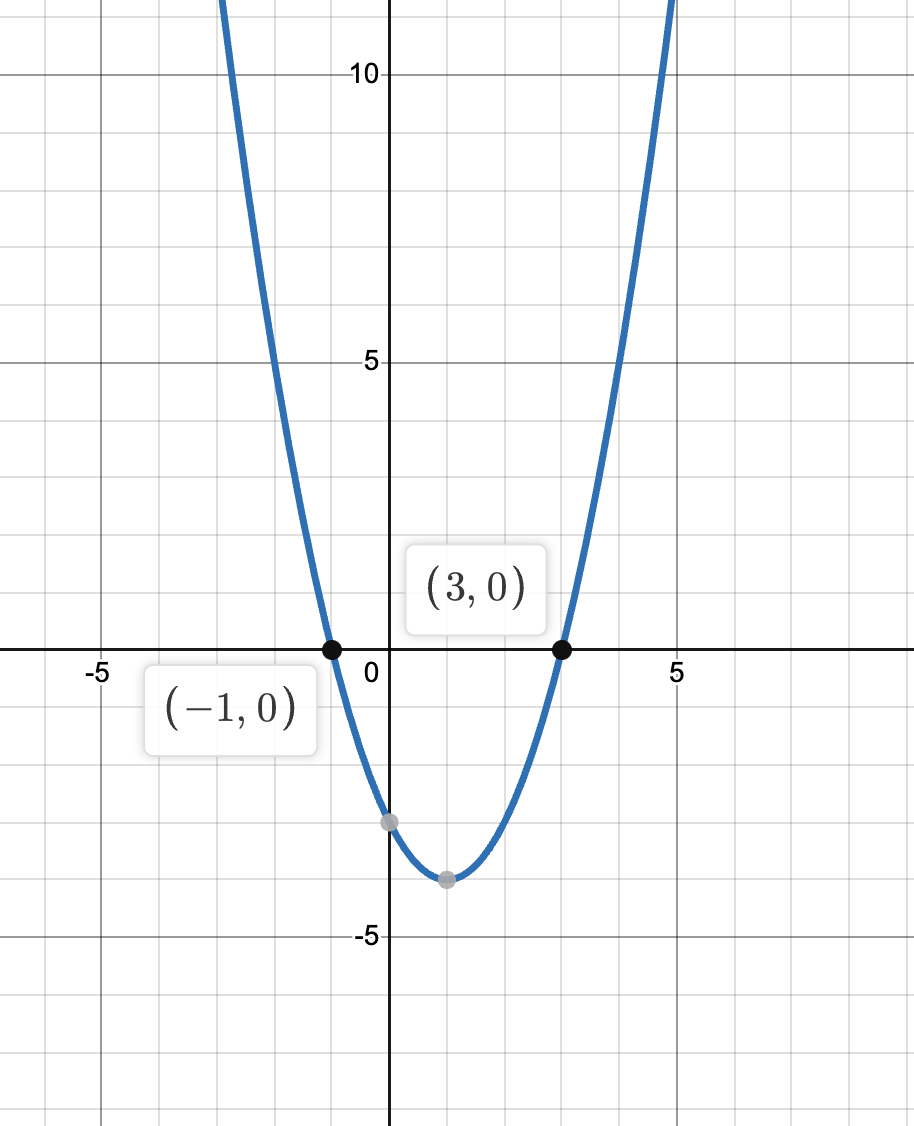
Quadratic Graphs
Sketching quadratic graphs involves identifying the vertex and roots, then drawing the curve.
Example Calculation for :
- Find the roots by solving .
- Determine the vertex using .
- Sketch the parabola through these points.
Interpreting Graphs
- Linear Graphs: The gradient indicates the rate of change.
- Quadratic Graphs: The direction (up or down) shows if is positive or negative. The vertex indicates the function's maximum or minimum.
Worked Examples
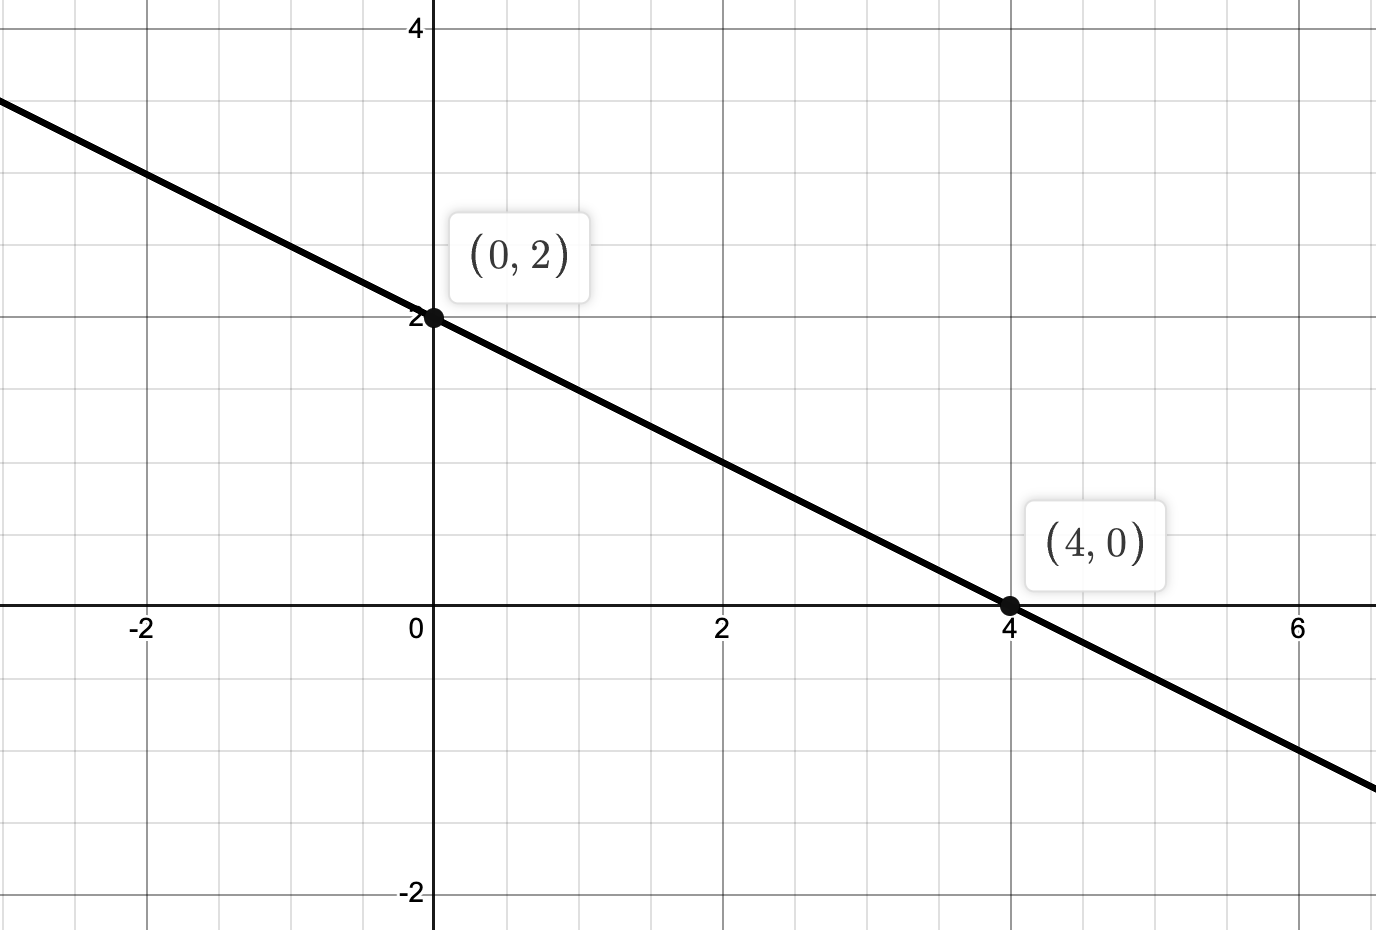
Example 1: Linear Function
- Y-intercept: At , , so plot .
- Gradient: indicates the line slopes downwards; for every 2 units right, it goes 1 unit down.
- Sketch: From , move right 2 units to (2, 1) and draw the line through these points.
Example 2: Quadratic Function
Solution:
- Roots: The solutions of are and .
- Vertex: The vertex is at , calculated from the equation and its derivative.
- Sketch: and , and the vertex at , draw the parabola passing through these points for a complete graph.