
Plotting and Interpreting Distance-Time and Displacement-Time Graphs
Distance-time and displacement-time graphs are fundamental tools in kinematics. They provide a visual representation of an object's motion over time, which can be used to understand and predict future motion.
Distance-Time Graphs
A distance-time graph plots the distance travelled by an object against time. The key characteristics of a distance-time graph are:
- The slope of the graph represents the speed of the object. A steeper slope indicates a higher speed.
- A horizontal line (zero slope) indicates that the object is at rest.
- A straight line indicates uniform motion, meaning the object is moving at a constant speed.
- A curved line indicates accelerated motion, meaning the object's speed is changing.

Distance-time graphs
Image Courtesy Geeksforgeeks
Displacement-Time Graphs
A displacement-time graph, on the other hand, plots the displacement of an object from its starting point against time. The key characteristics of a displacement-time graph are:
- The slope represents the velocity of the object.
- A positive slope indicates motion in the positive direction, while a negative slope indicates motion in the opposite direction.
- A horizontal line indicates that the object is at rest.
- A straight line indicates uniform motion, meaning the object is moving at a constant velocity.
- A curved line indicates accelerated motion, meaning the object's velocity is changing.
Differences Between Distance and Displacement Graphs
Although both graphs plot motion over time, they differ in several key ways:
- Distance is a scalar quantity, which means it only has magnitude and no direction. It represents the total path covered by an object. Displacement, however, is a vector quantity, which means it has both magnitude and direction. It represents the shortest distance from the starting point to the final position.
- In a distance-time graph, the distance can only increase or remain constant, reflecting the fact that distance travelled can never decrease. In a displacement-time graph, the displacement can increase, decrease, or remain constant, reflecting changes in direction.
- The slope of a distance-time graph represents speed, while the slope of a displacement-time graph represents velocity. This is because speed is the rate of change of distance, while velocity is the rate of change of displacement.
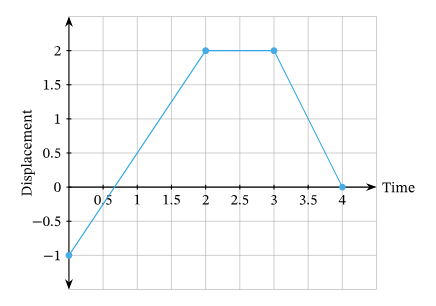
Displacement-time graph
Image Courtesy Nagwa
Analysing Slopes
The slope of a distance-time or displacement-time graph provides crucial information about the motion of an object:
- Rest: A horizontal line (zero slope) indicates that the object is at rest. The object is not moving, so its distance or displacement does not change over time.
- Uniform Motion: A straight line (constant slope) indicates uniform motion. The object is moving at a constant speed or velocity, so its distance or displacement increases linearly over time.
- Accelerated Motion: A curved line (changing slope) indicates accelerated motion. The object is either speeding up, slowing down, or changing direction, so its distance or displacement changes non-linearly over time.
Using Graphs to Solve Problems
Distance-time and displacement-time graphs can be used to solve a wide range of problems involving distance and displacement:
- The area under a speed-time or velocity-time graph represents the total distance or displacement. This is because the area of a graph is equal to the integral of the function it represents, and the integral of speed or velocity with respect to time is distance or displacement.
- By finding the slope of a distance-time or displacement-time graph at any point, you can determine the speed or velocity at that instant. This is because the slope of a graph is equal to the derivative of the function it represents, and the derivative of distance or displacement with respect to time is speed or velocity.
- By comparing the slopes at different points, you can determine whether the object is accelerating or decelerating. If the slope is increasing, the object is accelerating; if the slope is decreasing, the object is decelerating.
FAQ
The total distance travelled or total displacement can be calculated by finding the area under a speed-time or velocity-time graph. This is because the area of a graph is equal to the integral of the function it represents, and the integral of speed or velocity with respect to time is distance or displacement. The area can be calculated using geometric methods if the graph is composed of simple shapes like rectangles and triangles, or using numerical methods if the graph is more complex.
A straight line in a displacement-time graph that does not pass through the origin indicates that the object had a displacement from its starting point at time zero. The y-intercept of the line represents the initial displacement of the object. The slope of the line still represents the velocity of the object, and since the line is straight, this indicates that the object is moving with a constant velocity.
The uncertainty in a derived quantity can be calculated by adding together the uncertainties in the measurements used to derive it. There are two types of uncertainties: absolute uncertainty, which is the uncertainty in the measurement itself, often given as a ± value; and percentage uncertainty, which is the ratio of the absolute uncertainty to the measured value, expressed as a percentage. For example, if you're calculating displacement from initial and final positions, you would add the uncertainties in both positions to find the total uncertainty in the displacement.
The slope of a distance-time or displacement-time graph represents the speed or velocity of the object. If the slope is constant (i.e., the graph is a straight line), the object is moving at a constant speed or velocity, meaning it is not accelerating or decelerating. If the slope is changing (i.e., the graph is a curved line), the object is accelerating or decelerating. If the slope is increasing, the object is accelerating; if the slope is decreasing, the object is decelerating.
Speed is a scalar quantity, meaning it only has magnitude and no direction. It represents the rate of change of distance with respect to time. Velocity, on the other hand, is a vector quantity, meaning it has both magnitude and direction. It represents the rate of change of displacement with respect to time. In a distance-time graph, the slope represents speed, while in a displacement-time graph, the slope represents velocity. This means that the direction of motion can be inferred from a displacement-time graph (positive slope indicates positive direction, negative slope indicates negative direction), but not from a distance-time graph.
Practice Questions
The speed of the car during the first half of the journey can be found by dividing the distance travelled by the time taken. From the graph, we can see that the car travels 60 km in 10 minutes, or 1/6 of an hour. So its speed is 60/(1/6) = 360 km/h. The velocity is the displacement divided by the time, but since the car ends up back at its starting point, its total displacement is zero. Therefore, its velocity is 0/20 = 0 km/h. The total distance travelled is the sum of the distances for the two halves of the journey, or 60 + 60 = 120 km.
The velocity of the object can be found by finding the slope of the displacement-time graph. The slope is the change in displacement divided by the change in time, or (10-0)/(5-0) = 2 m/s. This is a positive value, which tells us that the object is moving in the positive direction. Since the graph is a straight line passing through the origin, this tells us that the object is moving with a constant velocity. This means that its speed and direction of motion are not changing over time.
