
Fundamentals of Measurement Uncertainty
Uncertainty in measurements is an integral part of scientific experiments. It's crucial to understand the nature of these uncertainties:
- Systematic Uncertainties: These errors are consistent in nature, often occurring due to instrument calibration errors or predictable environmental factors. Identifying and correcting systematic uncertainties is essential for accurate measurements.
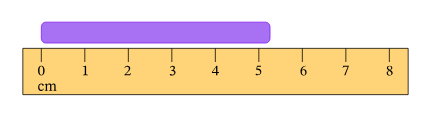
Image Courtesy Nagwa
- Random Uncertainties: These arise from unpredictable and variable factors, such as slight fluctuations in experimental conditions or inherent limitations of measuring instruments. They are typically assessed using statistical methods.
Evaluating Uncertainty in Derived Quantities
When dealing with derived quantities, it's important to accurately assess how uncertainties in individual measurements propagate through to the final result. Key methods include:
1. Error Propagation: This involves using calculus to determine how uncertainties in input quantities affect the uncertainty in a derived quantity. The rules vary depending on the mathematical operations involved:
- Addition or Subtraction: The absolute uncertainties of the individual measurements are added together.
- Multiplication or Division: The relative (percentage) uncertainties of the measurements are combined.
2. Monte Carlo Simulation: This statistical technique uses random sampling to simulate a range of possible outcomes based on the uncertainties of the input data. The resulting distribution provides an estimate of the uncertainty in the derived quantity.
Simple Addition of Uncertainties
- Absolute Uncertainties: When adding or subtracting quantities, their absolute uncertainties are combined linearly. For instance, if two lengths are measured with certain uncertainties, the total uncertainty in their sum or difference is the sum of their individual uncertainties.
- Percentage Uncertainties: In operations like multiplication or division, it's more appropriate to use percentage uncertainties. Here, the percentage uncertainties of each measurement are added to determine the overall uncertainty of the result.
Practical Application in Data Analysis
- Combining Measurements with Absolute Uncertainties: For example, in measuring the dimensions of a rectangular object, the uncertainties in length and width measurements are added to calculate the uncertainty in the area.
- Using Percentage Uncertainties: In calculating the density (density = mass/volume), the percentage uncertainties in both mass and volume measurements are added to find the total uncertainty in the calculated density.
Advanced Techniques for Uncertainty Analysis
- Correlation Effects: When dealing with correlated quantities, their uncertainties are not independent. In such cases, the covariance between these quantities must be considered in the uncertainty analysis.
- Least Squares Method: This statistical method is used for fitting models to data. It minimises the sum of the squares of the residuals (the differences between observed and predicted values) and provides a way to estimate the uncertainty in the model parameters.
- Graphical Analysis: Graphical representation of data with error bars can visually depict uncertainties, allowing for an intuitive understanding of the data's reliability.
The Importance of Accurate Uncertainty Assessment
Accurate uncertainty assessment is crucial for several reasons:
- Reliability of Results: It determines the reliability and validity of experimental findings.
- Comparative Analysis: It enables meaningful comparisons between different experiments or datasets.
Scientific Integrity: Proper uncertainty assessment upholds the integrity of scientific research, ensuring that conclusions are based on a thorough understanding of the data's limitations.
FAQ
Absolute and percentage uncertainties provide different insights into the data. Absolute uncertainty gives a direct measure of the range within which the true value lies, which is crucial for understanding the precision of individual measurements. Percentage uncertainty, on the other hand, allows for the comparison of uncertainties relative to the size of the measurements, making it easier to compare data of different magnitudes or units. In experimental physics, considering both types of uncertainties helps in assessing the reliability and comparability of different measurements and experiments.
The choice of equipment has a significant impact on the uncertainty of a measurement. Different instruments have varying degrees of precision and accuracy, which directly influence the uncertainty. For example, a digital scale might provide more precise measurements than an analogue scale. Additionally, the condition and calibration of the equipment play a crucial role. Well-maintained and regularly calibrated instruments generally yield more reliable and less uncertain measurements. Therefore, selecting appropriate equipment and ensuring its proper maintenance are key to reducing measurement uncertainties.
In practical terms, it's impossible to reduce the uncertainty in a measurement to zero. All measurements have some degree of uncertainty, arising from limitations in the measuring instruments, the skill of the observer, and inherent variability in the system being measured. Even the most precise instruments have a finite resolution and can be subject to external influences like temperature and pressure changes. The goal in experimental physics is not to eliminate uncertainty entirely but to understand and minimise it as much as possible.
When combining measurements from different experiments, it's crucial to consider the uncertainties of each measurement. If the measurements are added or subtracted, their absolute uncertainties are combined by adding them in quadrature. For multiplication or division, the relative or percentage uncertainties are added. It's also important to consider any correlation between the measurements; if they are not independent, this can affect the combined uncertainty. Careful analysis and understanding of the uncertainties involved in each measurement are essential for accurate and reliable combined results.
When using an analogue instrument, the uncertainty is often estimated as half the smallest scale division of the instrument. For instance, if you're using a ruler with millimetre markings, the smallest scale division is 1 mm, so the uncertainty is ±0.5 mm. This approach assumes a careful and consistent measurement technique. It's important to note that this is a general guideline and the actual uncertainty might vary based on factors like the condition of the instrument and the skill of the user.
Practice Questions
To calculate the density, we use the formula density = mass/volume. The mass is 200 ± 2 grams, and the volume is the cube of the side, 4.0^3 cm³. The uncertainty in the volume is found by multiplying the relative uncertainty in the side length by 3, as the side length is cubed. The relative uncertainty in the side length is (0.1/4.0) x 100% = 2.5%. Therefore, the uncertainty in the volume is 2.5% x 3 = 7.5%. The volume of the cube is 64 cm³, so its uncertainty is 7.5% of 64 cm³, which is 4.8 cm³. The density is 200/64 g/cm³, and the total uncertainty is the sum of the relative uncertainties in mass and volume, which is 1% + 7.5% = 8.5%. Therefore, the density of the cube is 3.125 ± 0.266 g/cm³.
To calculate g, we use the given values: L = 1.00 ± 0.01 meters and T = 2.00 ± 0.05 seconds. The formula for g is g = 4π²L/T². First, we calculate g using the central values: g = 4π² x 1.00 / 2.00² ≈ 9.87 m/s². To find the uncertainty in g, we add the relative uncertainties of L and T (since T is squared, its relative uncertainty is doubled). The relative uncertainty in L is (0.01/1.00) x 100% = 1% and in T is (0.05/2.00) x 100% x 2 = 5%. The total relative uncertainty in g is 1% + 5% = 6%. Therefore, the uncertainty in g is 6% of 9.87 m/s², which is approximately 0.59 m/s². Thus, g is 9.87 ± 0.59 m/s².
