The concept of the Geometric Distribution is an integral part of the study of probability and statistics. This distribution is specifically used to model the number of trials needed to achieve the first success in repeated, independent Bernoulli trials, where each trial has a binary outcome: success or failure. The 'Expectation of Geometric Distribution' is a key statistical measure that provides the average number of trials required to observe the first success.
Basics
- What It Is: Geometric Distribution applies when you repeat an experiment until you first succeed.
- Conditions:
- Each trial is independent.
- The probability of success (p) is the same every time.
- Probability Formula: The chance of first success on the try is .
Expected Value
- Mean: The average number of trials to get the first success.
- Formula: .
- Interpretation: More likely events need fewer trials on average.
Examples
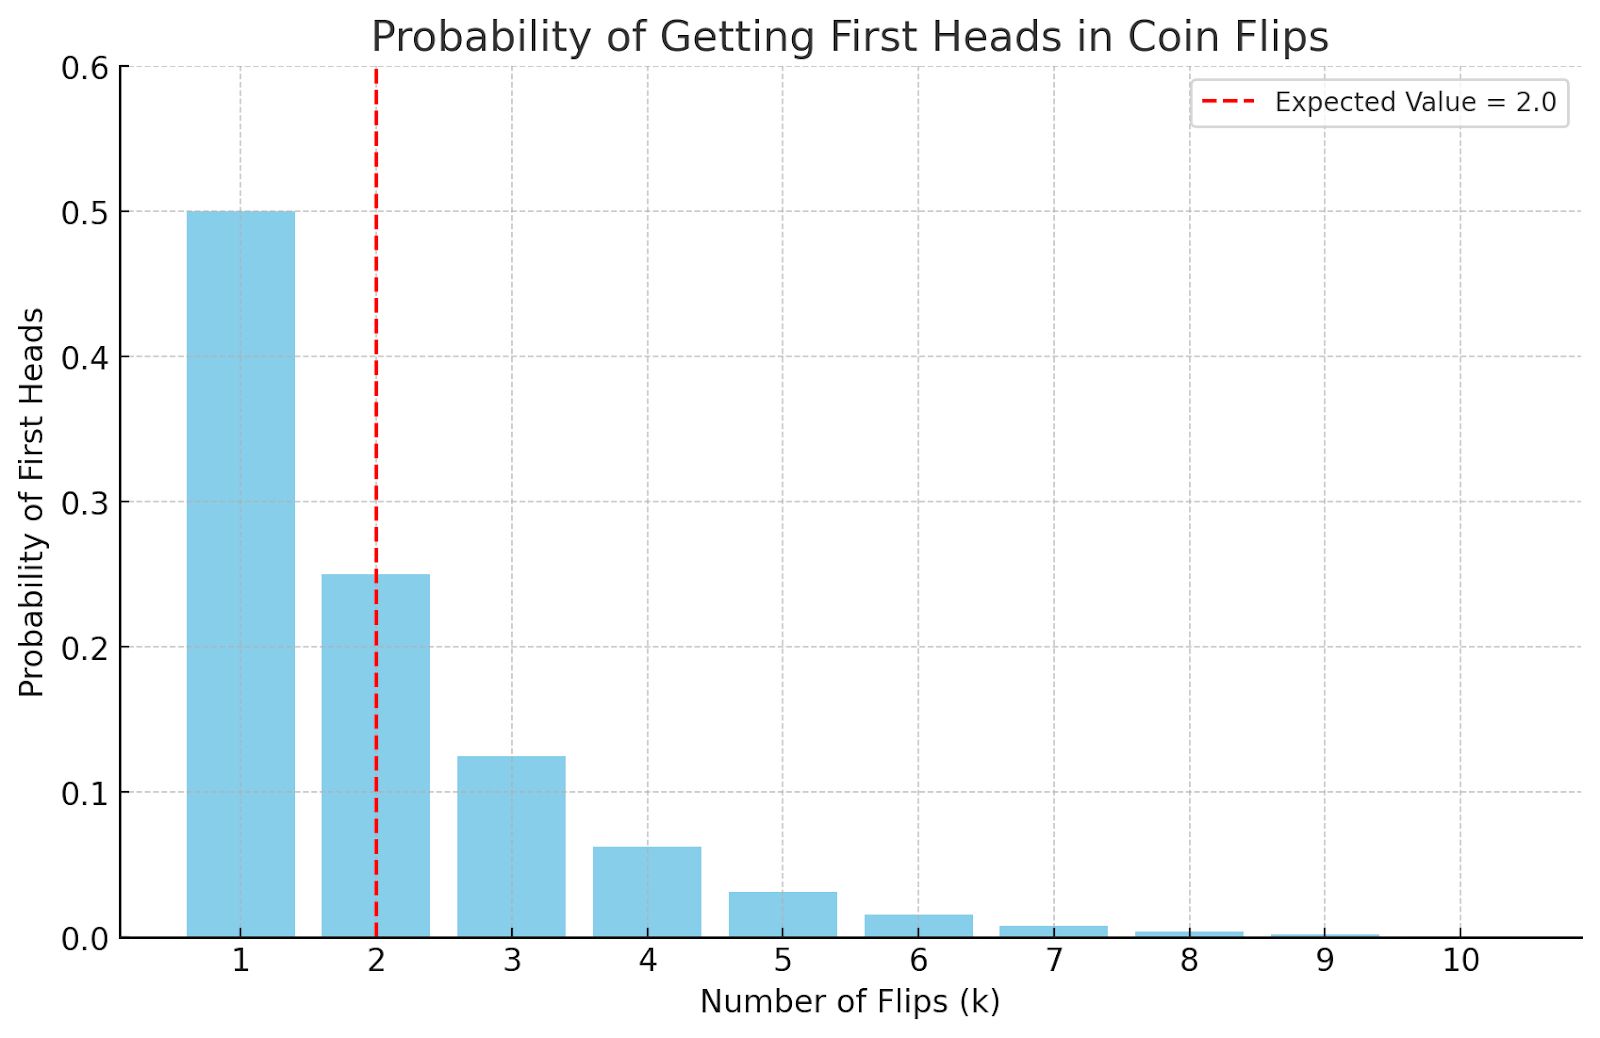
Example 1. Coin Flip
- Scenario: A fair coin (50% chance for heads).
- Expected Trials: 2 flips to get the first head.
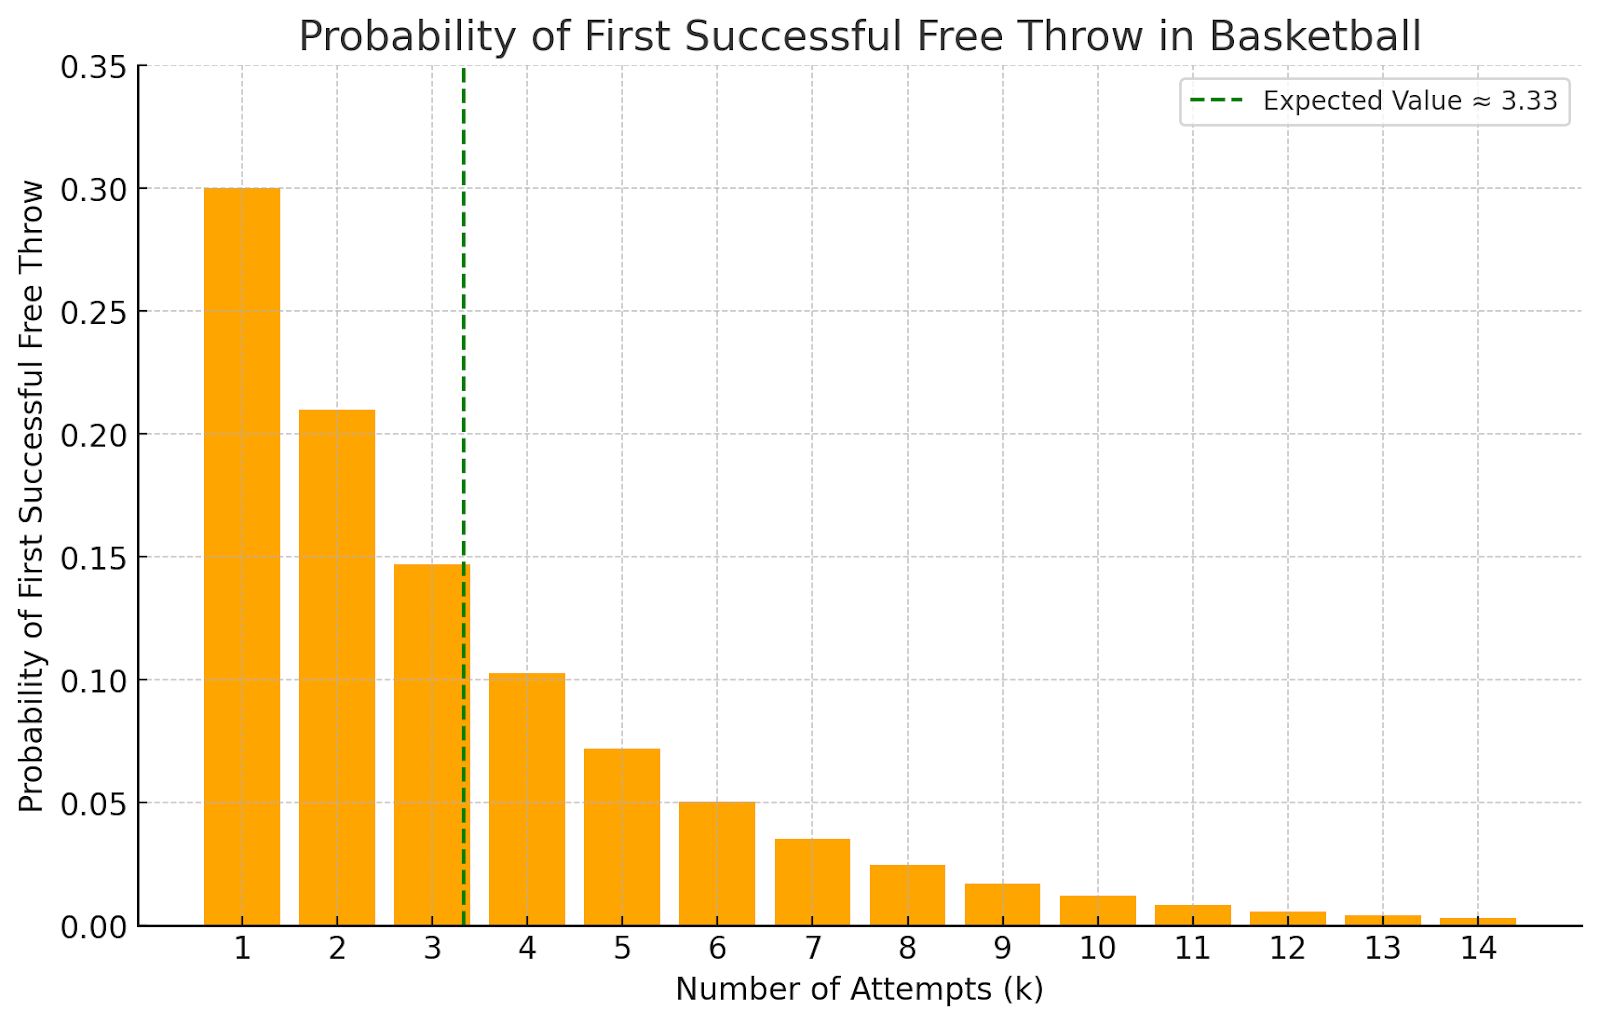
Example 2. Basketball Free Throws
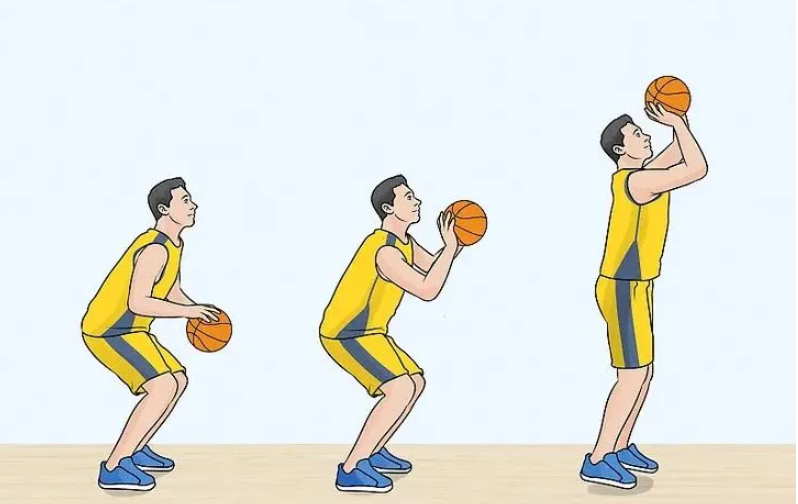
Image courtesy of wikihow
- Scenario: A player has a 30% chance to make a free throw.
- Expected Attempts: About 3-4 tries for the first successful throw.
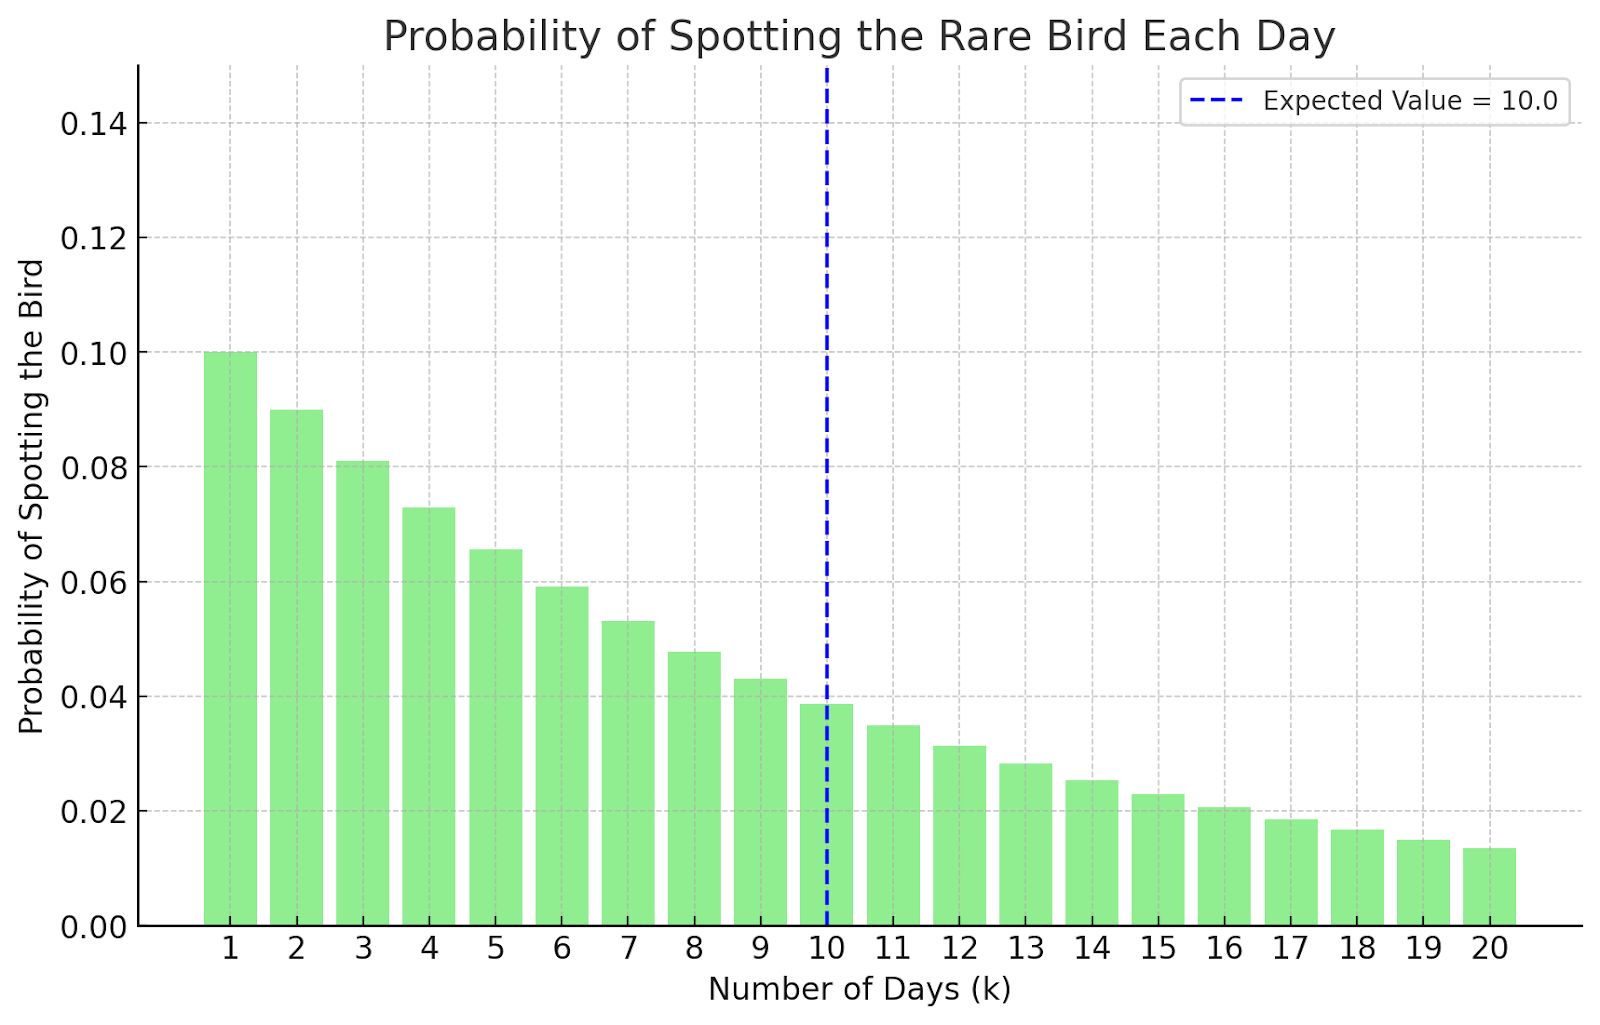
Example 3. Wildlife Observation

Image courtesy of arkwildlife
- Scenario: Spotting a rare bird with a 10% chance each day.
- Expected Days: On average, spot the bird on the 10th day.