The Binomial Distribution is a cornerstone in understanding statistical probability, particularly in contexts of binary outcomes like 'success' or 'failure'. This segment explores the expectation (mean) and variance of a Binomial Distribution, pivotal for evaluating its effectiveness in modeling diverse real-life scenarios.
Binomial Distribution Overview
Binomial Distribution, B(n, p), helps predict outcomes in scenarios with two possible results (success or failure) across multiple independent trials.
- Trials: Conducted n times independently.
- Success Probability: Each trial has a fixed probability of success, p.
- Outcomes: Each trial results in either success or failure.
- Expectation (Mean): The average outcome over many trials, calculated as E(X) = np.
- Variance: The spread of outcomes around the mean, calculated as Var(X) = np(1 - p).
Examples
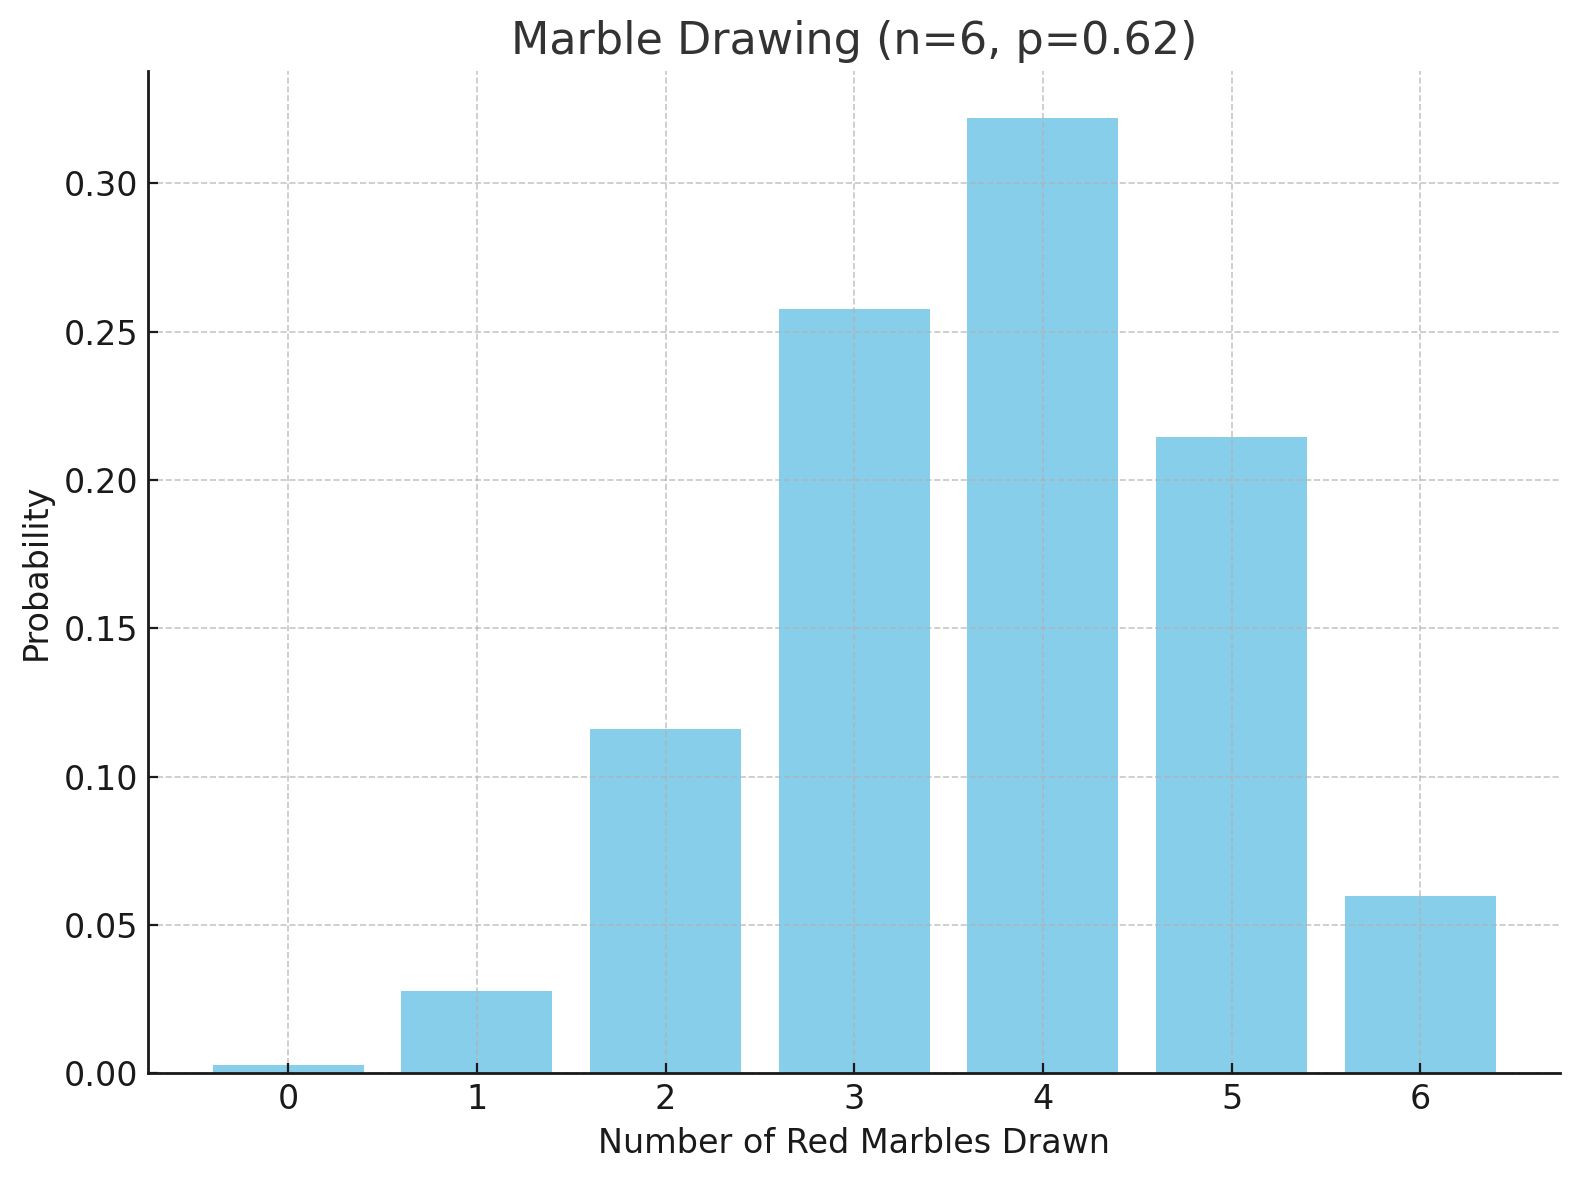
Example 1. Marble Drawing

Image courtesy of bestbobomk
Draw 6 marbles from a bag with 5 red out of 8 total marbles. The probability of drawing a red marble (p) = 5/8.
- Expectation:
- Variance:
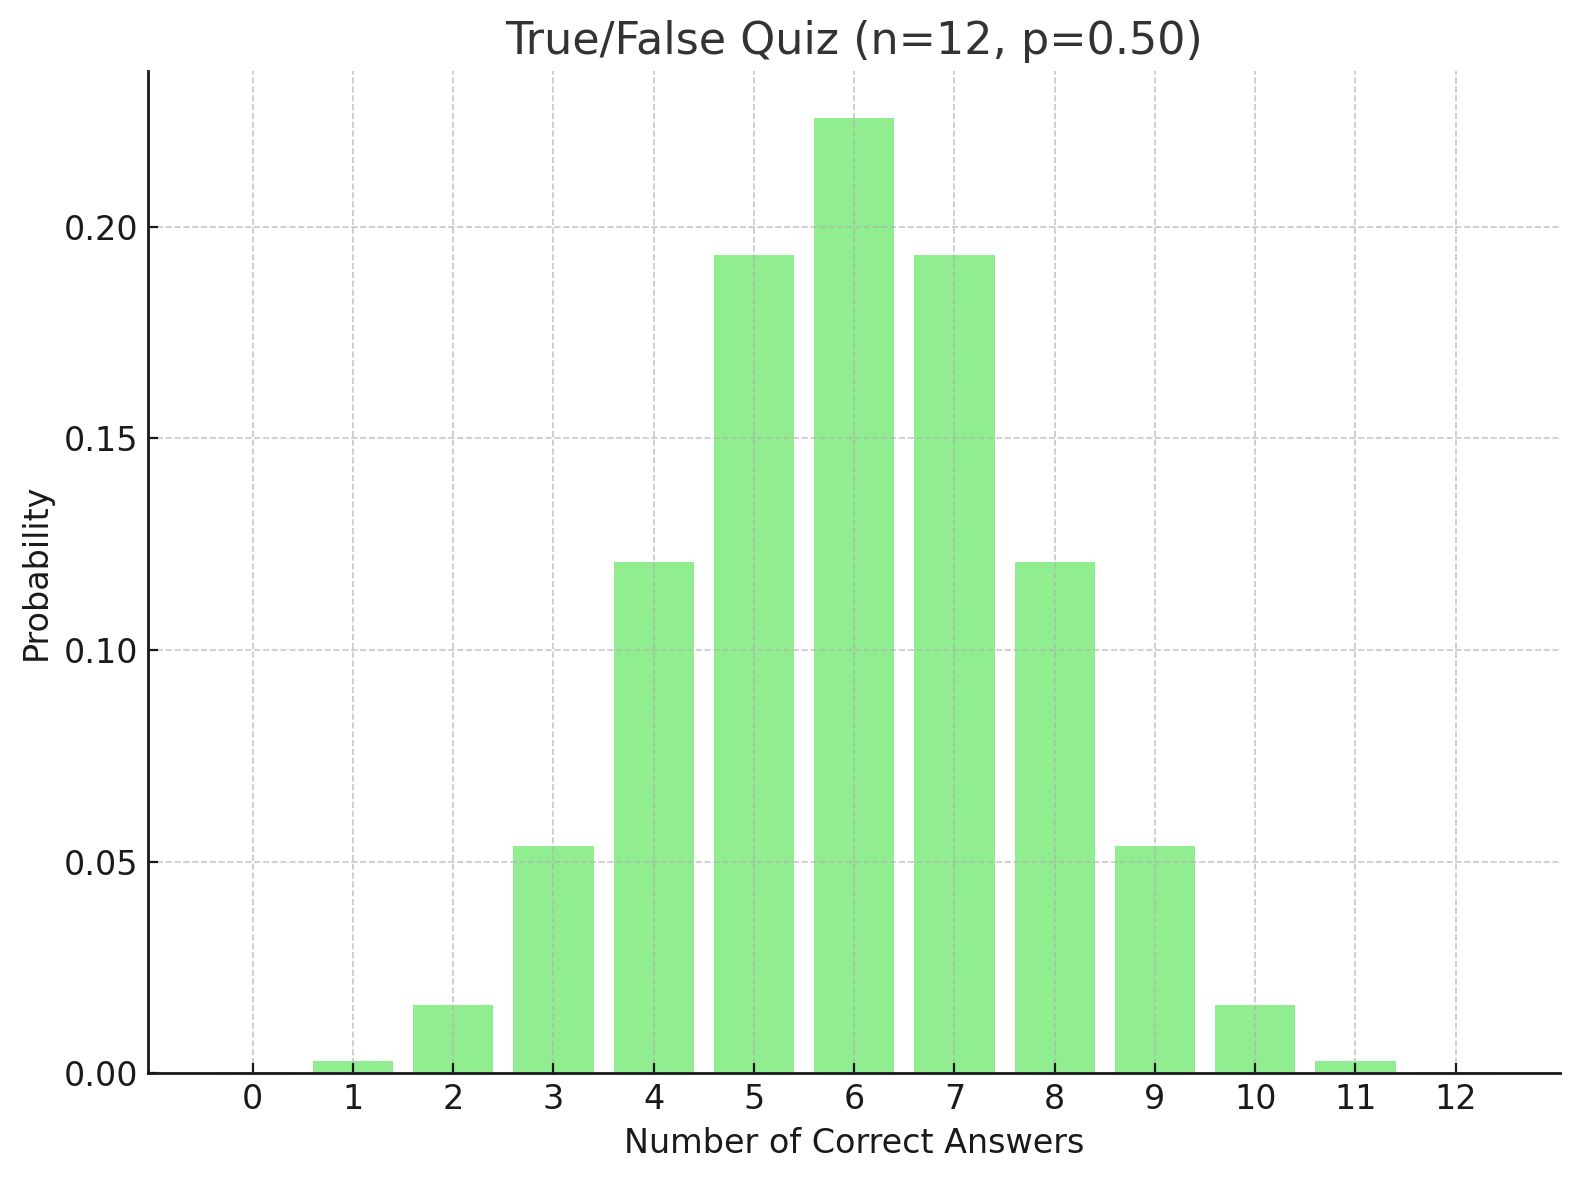
Example 2. True/False Quiz

Image courtesy of freepik
Answering 12 true/false questions with a 50% chance of guessing correctly.
- Expectation:
- Variance: