The normal distribution is a fundamental concept in statistics and a key model for continuous random variables. Its importance stems from its natural occurrence in many real-world phenomena and its central role in the Central Limit Theorem. This theorem suggests that the distribution of sample means approximates a normal distribution, regardless of the population's original distribution, provided the sample size is large.
Understanding the Normal Distribution
- Symmetry Around the Mean: The curve is symmetrical around the mean, where mean, median, and mode are equal.
- Defined by Mean and Variance: The mean (μ) sets the center; variance (σ²) defines the spread.
- Asymptotic: The tails extend indefinitely, indicating all values are possible but increasingly unlikely.
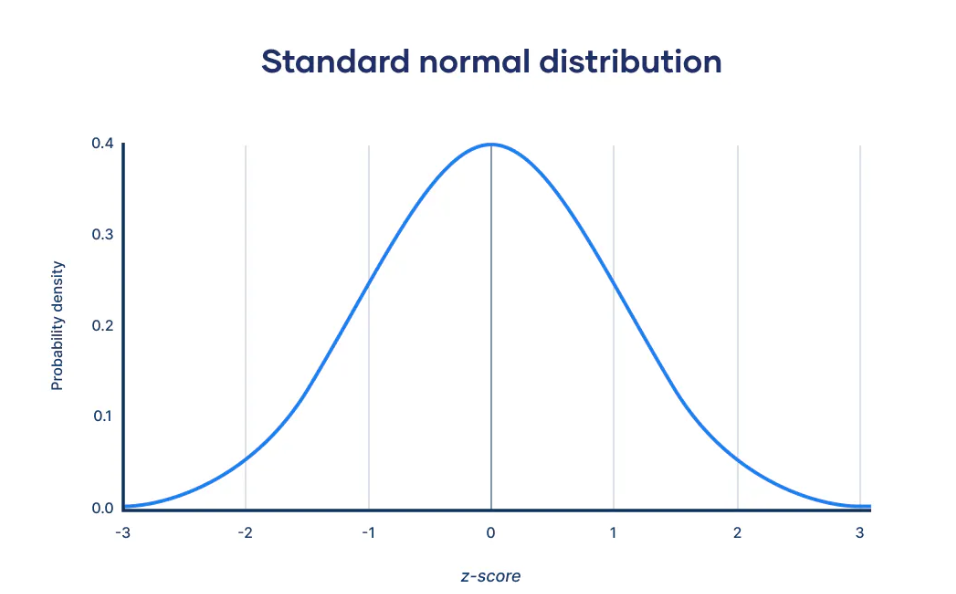
Image courtesy of scribbr
Standard Normal Distribution
Centralized around zero, standard deviation of one.
Applications
- Measurement Errors: In scientific experiments.
- Biological Attributes: Like population heights.
- Financial Models: Like stock market returns.
Using Normal Distribution Table
- Standardization: Convert to Z-score using .
- Lookup: Find Z-score in the table for the probability.
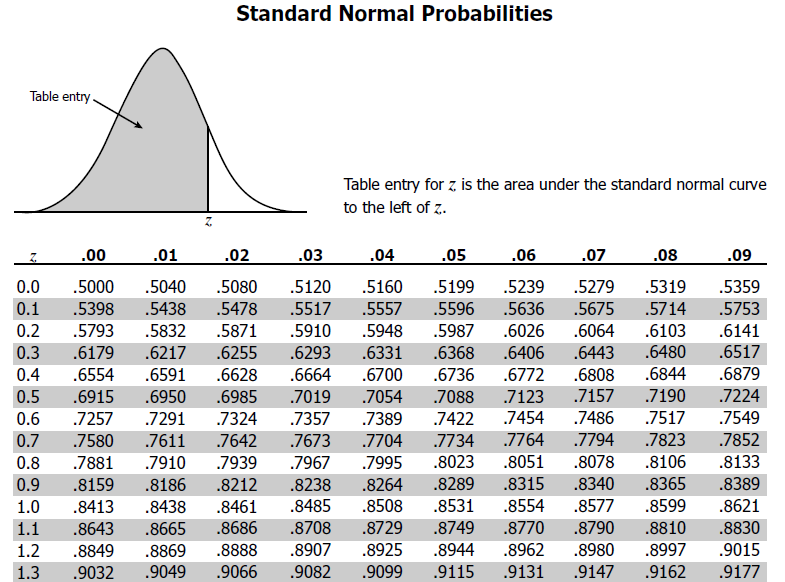
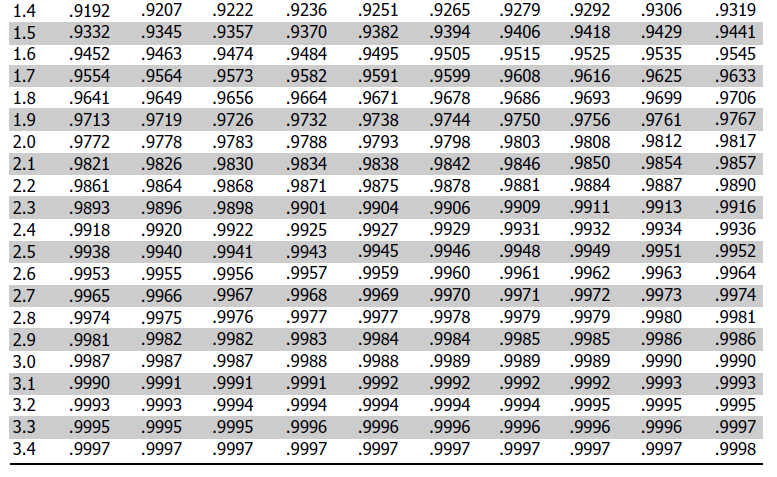
Image courtesy of byjus
Sketching Normal Curves
- Draw Axis: Mark variable range.
- Indicate Mean: Center curve at the mean.
- Shape Curve: Symmetrical, bell-shaped.
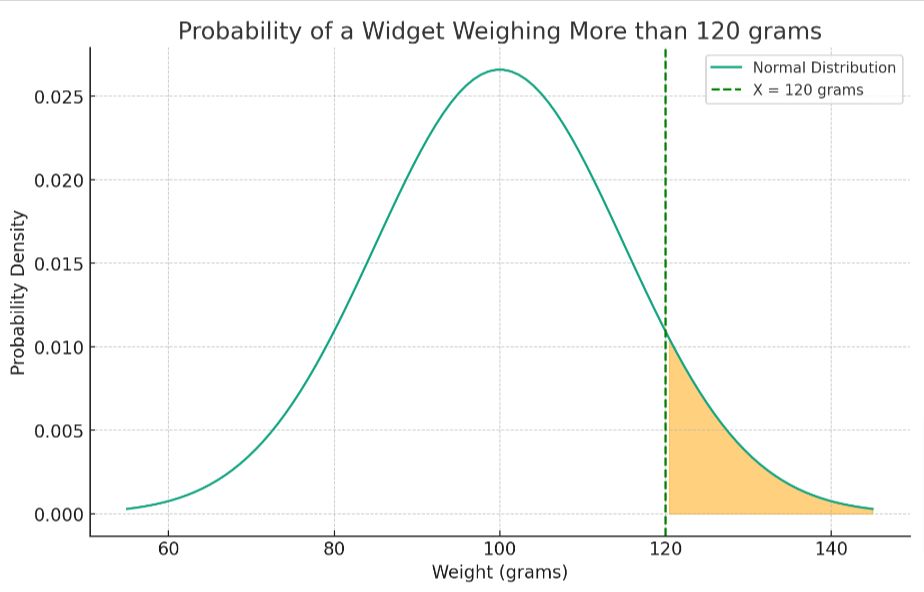
Example: Widget Weights
- Given: Mean = 100 grams, Standard Deviation = 15 grams.
- Find: Probability of > 120 grams.
- Solution: .
- Probability: .
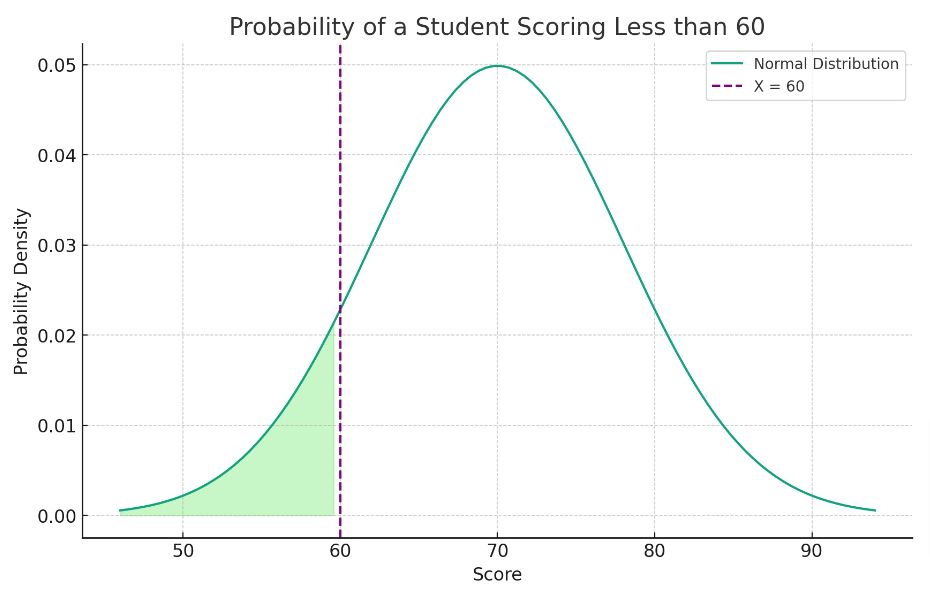
Example: Test Scores
- Given: Mean = 70, Standard Deviation = 8.
- Find: Probability of < 60.
- Solution: .
- Probability: .