
Producer surplus is a key concept in economics, capturing the difference between the market price and the minimum price producers are willing to accept for a product. This surplus is essential in assessing the health and efficiency of markets, as well as understanding the welfare of producers. In this detailed exploration, we will dissect the concept of producer surplus, its calculation methodologies, and its graphical representation.
Understanding Producer Surplus
Definition and Importance
- Definition: Producer surplus is the difference between the market price received by producers for a good and the lowest price they are willing to accept for it. It is a measure of producer welfare.
- Economic Importance: This concept helps in understanding how producers benefit from market transactions. It is a vital tool in assessing the impact of economic policies and market changes on producers.
Relationship with Market Dynamics
- Market Price Fluctuations: Changes in market price directly affect producer surplus. A higher market price increases the surplus, indicating greater producer welfare.
- Cost of Production: Changes in production costs, due to technological advancements or changes in input prices, also impact producer surplus.
Calculating Producer Surplus
Basic Calculation
- Formula: The basic formula involves finding the area above the supply curve and below the market price, up to the quantity sold.
- Example: Suppose the supply curve is given by P = 2Q, and the market price is £10 for a quantity of 3 units. The calculation would be:
- Minimum price at which producers are willing to sell = 2Q = 2*3 = £6
- Producer Surplus per unit = Market price - Minimum price = £10 - £6 = £4
- Total Producer Surplus = Surplus per unit * Quantity = £4 * 3 = £12
Advanced Calculations
- Non-Linear Supply Curves: In real-world scenarios with non-linear supply curves, calculus is often required to accurately calculate the surplus.
Graphically Representing Producer Surplus
Components of the Graph
- Supply Curve: An upward-sloping line that reflects the minimum price at which producers are willing to sell various quantities.
- Equilibrium Point: The intersection of demand and supply curves, indicating market price and quantity.
Depicting Producer Surplus
- Area of Surplus: The area above the supply curve, below the market price, and up to the equilibrium quantity represents the producer surplus.
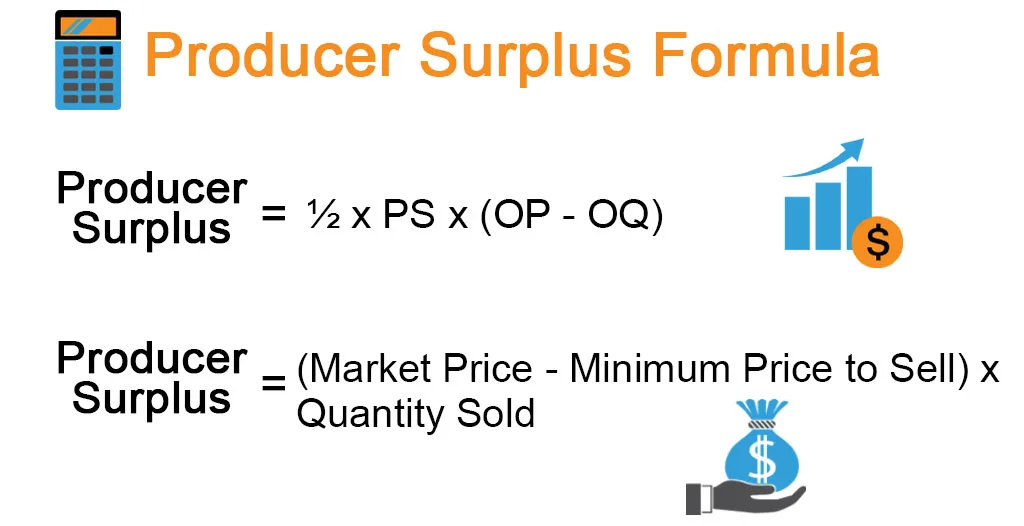
Image courtesy of educba
- Example Diagram: A graph with price on the y-axis and quantity on the x-axis, illustrating the supply curve, equilibrium point, and the shaded area of surplus.
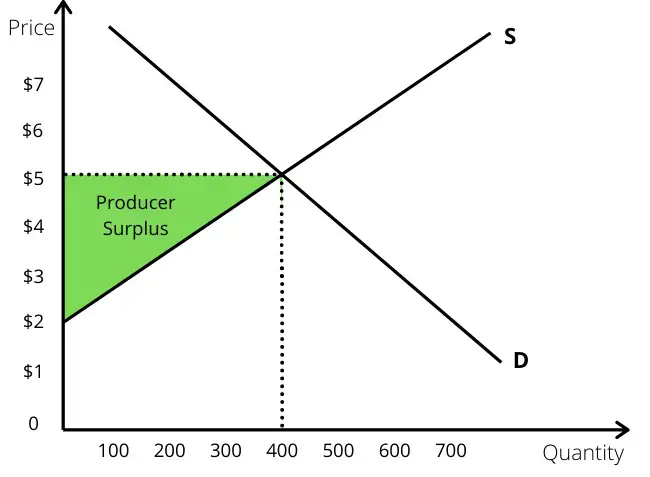
Image courtesy of boycewire
Factors Affecting Producer Surplus
Market Influences
- Price Elasticity of Supply: The responsiveness of the quantity supplied to a change in price can significantly impact the producer surplus.
- Market Structure: The level of competition in the market can influence producer surplus. In monopolistic markets, for example, surplus can be significantly higher due to pricing power.
Policy Impacts
- Taxation and Subsidies: Government policies like taxes and subsidies have direct effects on producer surplus. Taxes generally decrease it, while subsidies can increase it.
Real-World Applications and Case Studies
Sectoral Analysis
- Agriculture: Variability in surplus due to factors like weather conditions, subsidies, and global market prices.
- Technology: The impact of innovation in reducing costs and increasing surplus.
Policy Implications
- Economic Policy Analysis: Understanding how different economic policies, like tariffs or environmental regulations, affect producer surplus in various industries.
- Welfare Implications: Analysing the distribution of surplus among different producer groups to assess economic welfare.
Producer Surplus and Market Efficiency
Economic Efficiency
- Allocative Efficiency: Producer surplus is a component in measuring market efficiency. Together with consumer surplus, it helps in evaluating the allocative efficiency of a market.
- Welfare Economics: The study of how the allocation of resources affects economic well-being, where producer surplus is a crucial element.
Dynamic Markets
- Changing Market Conditions: The role of producer surplus in understanding the impact of dynamic market conditions like technological changes, global economic shifts, and regulatory changes.
Conclusion
In-depth knowledge of producer surplus provides valuable insights into the functioning of markets, the welfare of producers, and the impact of economic policies. For A-Level Economics students, mastering this concept is not just about understanding a theoretical construct but about gaining a tool for analysing real-world economic scenarios. As markets continue to evolve, the significance of producer surplus in economic analysis remains paramount, offering a window into the complex interplay of market forces and producer welfare.
FAQ
Externalities, which are costs or benefits incurred by third parties not directly involved in a market transaction, can significantly impact producer surplus. Positive externalities, such as technological innovations or improved infrastructure, can increase producer surplus. These external benefits often lead to reduced production costs or increased demand for products, which can raise the market price or enable producers to sell more units, thereby increasing their surplus. Conversely, negative externalities, like environmental pollution or social costs, can eventually decrease producer surplus. They might lead to increased regulation, taxes, or shifts in consumer preferences, all of which can raise production costs or reduce market prices. Additionally, in the presence of negative externalities, the true economic cost of production is not reflected in the market price, leading to a misallocation of resources and a producer surplus that does not accurately represent the overall economic welfare.
In cost-benefit analysis, producer surplus plays a crucial role in assessing the economic feasibility and overall benefit of a project, policy, or decision from the perspective of producers. It represents the benefits that producers receive, which is a key component in calculating the total benefits of an economic activity. When conducting a cost-benefit analysis, the change in producer surplus is often measured to determine how producers are affected by a proposed change. An increase in producer surplus suggests that producers are better off as a result of the project or policy, contributing positively to the overall economic assessment. Conversely, a decrease in producer surplus indicates that producers are worse off, which might be a factor against the implementation of the project or policy. Including producer surplus in cost-benefit analysis ensures a more comprehensive evaluation of the economic impact, taking into account not just consumer benefits or costs, but also the welfare of producers.
Producer surplus cannot be negative by its standard definition, as it represents the difference between the market price and the minimum price a producer is willing to accept. This surplus is essentially a measure of the benefit or extra revenue that producers earn over what they would minimally accept to cover their costs and remain in business. In a functional market, the market price is typically at or above this minimum acceptable price, resulting in a non-negative surplus. However, in theoretical scenarios where the market price falls below the minimum price producers are willing to accept, it could lead to situations where producers are operating at a loss, but this would not be termed as negative producer surplus. Instead, it would indicate a market failure or a situation where producers are selling at prices that are unsustainable in the long term.
Producer surplus and profit, while related, are distinct concepts in economics. Producer surplus specifically measures the difference between the market price a producer receives for a good and the lowest price they would be willing to accept for it. This concept focuses on the benefit producers derive from selling at market price, not taking into account their production costs. On the other hand, profit is a broader term that refers to the financial gain a producer makes after subtracting all their costs, including production, operational, and fixed costs, from the total revenue. While producer surplus is a component of profit, it does not encompass all the elements that determine a producer's overall financial gain. In essence, producer surplus can be seen as a segment of profit, reflecting the gain over and above the minimum acceptable revenue, but not accounting for the entirety of the costs incurred in production.
A price ceiling, set below the market equilibrium price, negatively impacts producer surplus. When a price ceiling is imposed, it limits the maximum price that producers can charge for their goods or services. This artificial cap on price typically falls below the equilibrium price, where the supply and demand naturally meet. As a result, the market price is forced down, reducing the area between the supply curve and the price line, which represents the producer surplus. Essentially, producers receive less than what they would in an unregulated market, leading to a decrease in their surplus. The severity of the impact on producer surplus depends on the difference between the ceiling price and the equilibrium price, as well as the elasticity of the supply curve. In extreme cases, this can lead to significant losses for producers, potentially causing them to reduce supply or exit the market altogether.
Practice Questions
In a perfectly competitive market, a decrease in production costs would lead to an increase in producer surplus. This is because the decrease in costs would lower the minimum price at which producers are willing to sell their goods, widening the gap between this minimum price and the market price. Consequently, the area between the supply curve and the market price, representing the producer surplus, would increase. This increase in surplus indicates improved producer welfare, as they are now receiving more for their goods than the minimum they would have been willing to accept.
The introduction of a subsidy in a market with a linear supply curve leads to an increase in producer surplus. Graphically, the subsidy shifts the supply curve downward, as it effectively lowers the production cost. This shift results in a new equilibrium with a lower market price but a higher quantity. The producer surplus, represented by the area above the supply curve and below the market price, expands because the subsidy increases the difference between the market price and the minimum price producers are willing to accept. This larger area reflects an increase in producer welfare due to the subsidy.
