
In economics, distinguishing between shifts in demand and supply curves and movements along these curves is essential for understanding market dynamics. This section explores these concepts in depth, providing real-world examples to illustrate the differences.
Introduction to Curve Analysis
Grasping the intricacies of how demand and supply curves respond to various market factors is vital for a comprehensive understanding of economics. This involves differentiating between curve shifts and movements along the curve.
Understanding Curve Shifts
Demand Curve Shifts
- Definition: A shift in the demand curve signifies a change in the entire demand relationship, reflecting a change in the quantity demanded at every price level. It differs from a movement along the demand curve, which occurs due to a price change for the product itself.
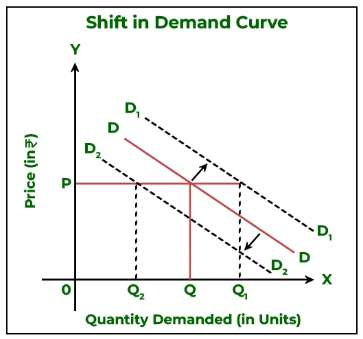
A graph illustrating the shifts in the demand curve.
Image courtesy of geeksforgeeks
- Causes of Shifts: Various factors can cause shifts in the demand curve:
- Income Levels: Increases or decreases in consumer income can lead to higher or lower demand for certain goods.
- Consumer Preferences: Changes in tastes and trends can significantly impact demand.
- Substitutes and Complements: The availability and pricing of related goods affect demand.
- Demographic Changes: Variations in population size, age structure, and other demographics can shift demand.
- Expectations: Anticipations of future price changes or income can affect current demand.
Supply Curve Shifts
- Definition: A shift in the supply curve represents a change in the quantity supplied at every price point, differing from a movement along the curve caused by a price change.
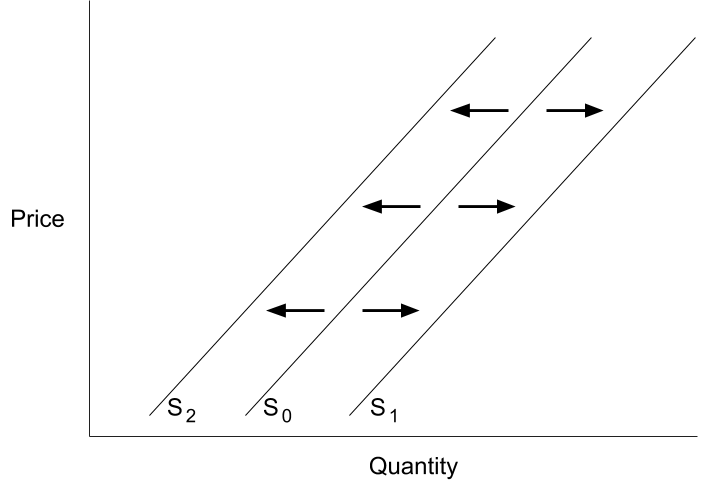
A graph illustrating the shifts in the supply curve.
Image courtesy of lumenlearning
- Causes of Shifts: Supply curve shifts can result from:
- Production Costs: Changes in costs of raw materials, labor, and other inputs affect supply.
- Technological Advances: Innovations can increase efficiency and output, shifting the supply curve.
- Natural Conditions: Factors like weather and natural disasters can impact supply.
- Government Policies: Taxes, subsidies, and regulations can alter production costs and incentives.
- Market Expectations: Expectations about future market conditions can influence current supply decisions.
Understanding Movements Along Curves
Movements Along the Demand Curve
- Description: Movements along the demand curve happen when there is a change in the quantity demanded resulting from a price change, with all other factors held constant.
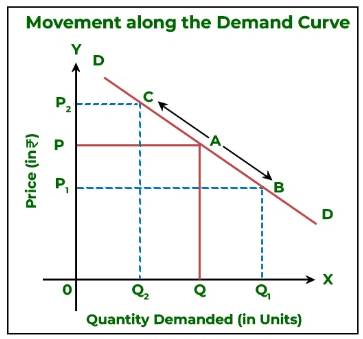
A graph illustrating the movement along the same demand curve from one point to the other.
Image courtesy of geeksforgeeks
- Example: A drop in the price of a popular book leads to an increase in its sales, illustrating a downward movement along the demand curve.
Movements Along the Supply Curve
- Description: Movements along the supply curve occur when the quantity supplied changes in response to a change in the good's price, while other influences remain constant.
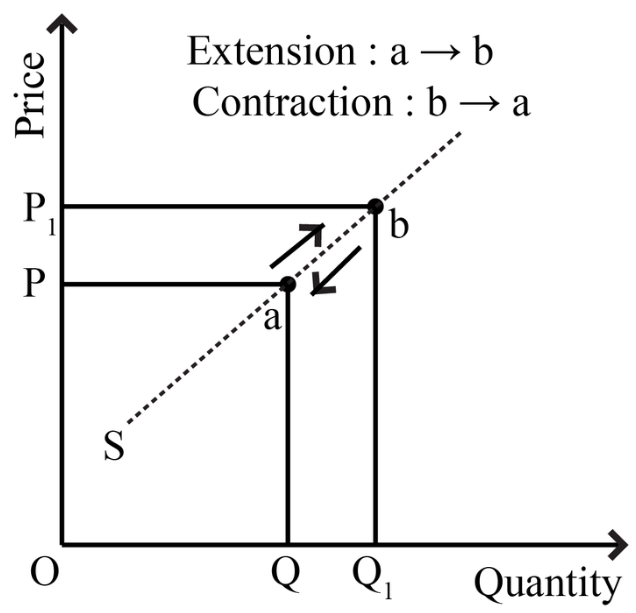
A graph illustrating the movement along the same supply curve.
Image courtesy of byjus
- Example: An increase in the price of wool may prompt producers to supply more wool, showing an upward movement along the supply curve.
Real-World Examples
Demand Curve Shifts
- Example 1: The rise in popularity of fitness and health trends can increase the demand for gym memberships and health foods, shifting the demand curve rightwards.
- Example 2: Economic recession can lead to a decrease in demand for luxury goods as consumer income falls, shifting the demand curve leftwards.
Supply Curve Shifts
- Example 1: The introduction of automated manufacturing in car production can enhance production efficiency, shifting the supply curve of cars to the right.
- Example 2: An outbreak of disease in livestock can reduce the supply of meat products, shifting the supply curve to the left.
Movement Examples
- Demand Movement: A seasonal decrease in the price of air conditioners during winter leads to a downward movement along the demand curve.
- Supply Movement: An unexpected rise in the price of crude oil can lead to an upward movement along the supply curve for petrol.
Distinguishing Between Shifts and Movements
- Causal Factors: Shifts result from changes in non-price determinants of demand or supply, while movements are caused by changes in the price of the good or service.
- Direction of Change: Shifts result in a new demand or supply curve, while movements signify a new point along the existing curve.
- Market Implications: Shifts indicate broader changes in the market or economy, such as consumer preferences or production technologies, whereas movements are reactions to price changes.
Illustrative Examples
Shift Example: Technology and Entertainment
- The advent of streaming services has dramatically shifted the demand curve for traditional cable television services to the left, as consumers prefer the new technology.
Movement Example: Fuel Prices
- Fluctuations in fuel prices can cause movements along the demand and supply curves for cars, with lower fuel prices potentially increasing the demand for larger, less fuel-efficient vehicles.
Conclusion
In conclusion, understanding the differences between shifts and movements in demand and supply curves is fundamental to analyzing market behavior. These concepts are crucial for interpreting how various factors influence market dynamics, enabling a deeper understanding of economic principles.
With this knowledge, students of economics can better comprehend how markets function and how different factors can impact demand and supply. Whether examining the effects of a new technology, a change in consumer tastes, or a shift in government policy, the ability to distinguish between shifts and movements along demand and supply curves provides a valuable tool for economic analysis.
FAQ
Natural events, particularly weather changes, can dramatically affect the supply curve for agricultural products. Adverse weather conditions like droughts, floods, or extreme temperatures can reduce crop yields, leading to a leftward shift in the supply curve. This shift indicates a decrease in the quantity supplied at each price level due to the reduced availability of agricultural products. For example, a severe drought can significantly diminish wheat production, reducing the overall supply of wheat in the market. Conversely, exceptionally good weather conditions can lead to bumper crops, increasing the supply and causing a rightward shift in the supply curve. These shifts are not movements along the supply curve, as they are caused by external factors unrelated to the price of the product itself. Agricultural markets are particularly susceptible to such shifts due to their reliance on weather conditions.
Technological advancements typically cause the supply curve to shift to the right. This shift is attributed to improvements in production methods and efficiencies brought about by new technologies. For example, the adoption of automation and AI in manufacturing can significantly reduce production times and costs, allowing firms to produce more goods at each price level. These advancements can also lead to the creation of new products or improve the quality of existing ones, enhancing their marketability. Additionally, technology can expand the capacity for production, overcoming previous limitations. This increase in supply due to technological progress is not a movement along the curve but a shift, as it changes the entire supply relationship at all price points. The extent of the shift depends on the scale and impact of the technological change within the industry.
Changes in government policy can have a profound impact on the supply curve. Policies such as subsidies, taxes, import tariffs, and regulations can alter production costs and market conditions, leading to shifts in the supply curve. For instance, if the government introduces a subsidy for renewable energy technology, the production cost for companies in this sector would decrease. This reduction in cost enables companies to supply more at each price level, resulting in a rightward shift in the supply curve. On the other hand, if the government imposes new environmental regulations that increase production costs, the supply curve would shift to the left. This leftward shift reflects a decrease in the quantity supplied at each price level, as it becomes more expensive for companies to produce the same amount of goods. Government policies are therefore critical factors in supply curve analysis, as they can directly influence the cost structure and operational environment for businesses.
Consumer expectation of future prices can significantly impact the demand curve. If consumers expect prices to rise in the future, they are likely to increase their current demand for the product, leading to a rightward shift in the demand curve. This shift implies that, at every price level, a higher quantity is demanded than before. For example, if people anticipate a future increase in fuel prices, they might choose to fill their tanks now, increasing current demand for fuel. This behaviour is based on the psychological inclination to avoid higher costs in the future. Conversely, if consumers expect prices to drop in the future, they might reduce their current demand, waiting for the lower prices, thus causing a leftward shift in the demand curve. This dynamic is crucial in markets where price fluctuations are common and predictable, such as electronics or seasonal goods.
Demographic changes can influence the demand curve for certain products by altering the composition and size of the market. Changes in factors like age distribution, population growth, urbanisation, and cultural dynamics can lead to shifts in the demand curve. For instance, an aging population may increase the demand for healthcare services and products related to elderly care, shifting the demand curve to the right. Similarly, a rise in the number of young families could increase the demand for child-related products, such as toys and educational materials. These shifts are a result of changes in the potential consumer base and their needs, reflecting a change in the quantity demanded at every price level. Demographic trends are crucial for long-term market predictions and strategic planning for businesses, as they can significantly reshape consumer demand patterns over time.
Practice Questions
An increase in consumer income would lead to a rightward shift in the demand curve for luxury cars. This shift signifies that at each price level, a greater quantity of luxury cars is demanded. This change is due to the income effect, where higher consumer income increases the purchasing power, enabling more consumers to afford luxury cars. This scenario assumes that luxury cars are normal goods, which see increased demand with rising income. It is not merely a movement along the demand curve, as the change is caused by a factor other than the price of luxury cars.
A movement along the supply curve for wheat could occur due to a change in the price of wheat. For instance, if the market price of wheat increases, this would cause a movement up along the supply curve. This upward movement indicates that producers are willing and able to supply more wheat at the higher price. The rationale behind this is that the increased price makes it more profitable for farmers to produce and sell wheat, incentivising them to increase production. This is a movement along the curve as it is a response to a change in the price of wheat itself, not due to external non-price factors.
