
Introduction to Supply Curve Shifts
The supply curve in economics graphically represents the relationship between the price of a good and the quantity supplied by producers. Shifts in the supply curve are pivotal as they indicate changes in supply due to factors other than price. These shifts can be either an increase or decrease in the overall supply, reflecting a rightward or leftward shift in the curve, respectively.
Technological Advancements
Enhancing Production Capabilities
- Advanced Manufacturing Technologies: Innovations in manufacturing, such as automation and AI, often lead to increased production efficiency, enabling firms to supply more at lower costs.
- Development of New Products: Technological breakthroughs can lead to new or improved products, expanding the range and quantity of goods supplied in the market.
Case Studies and Examples
- Automated Production Lines: In sectors like automotive manufacturing, robotics and automation have significantly increased output, shifting the supply curve rightward.
- Biotechnology in Agriculture: The introduction of genetically modified crops has revolutionized agriculture, increasing food supply by enhancing crop resistance to diseases and pests.

Image courtesy of market
Input Costs
Direct Impact on Supply
- Fluctuation in Raw Material Prices: Variations in the costs of raw materials, like metals or energy, directly affect production expenses. An increase in these costs can decrease supply, shifting the curve leftward.
- Wage Dynamics: Changes in labor costs, due to wage increases or labor shortages, can also impact the supply curve. Higher labor costs might reduce the quantity of goods a firm can supply at a given price.
Real-World Implications
- Oil Market Volatility: The supply of petroleum-based products is acutely sensitive to changes in crude oil prices. Higher oil prices can decrease the supply of these products.
- Impact of Minimum Wage Policies: Increases in the minimum wage can lead to a reduction in supply in labor-intensive industries, as firms adjust to higher production costs.
Climatic Conditions
Weather and Natural Supply
- Impact of Weather Extremes: Agriculture, heavily dependent on weather conditions, faces supply fluctuations due to events like droughts, floods, or unseasonal temperatures.
- Long-Term Climate Effects: Persistent changes in climate patterns can lead to significant alterations in agricultural supply, as farming regions adapt to new conditions.
Case Studies
- Droughts and Crop Supply: Severe droughts in key agricultural regions can drastically reduce the supply of staple crops, causing global supply chain disruptions.
- Fishing Industry Challenges: Variations in oceanic temperatures and conditions can impact fish populations, affecting the supply of various seafood products.
Graphical Analysis of Supply Curve Shifts
Graphical Representation
- Rightward Shift Illustration: This shift, representing an increase in supply, can be caused by factors like technological advancements or reductions in input costs.
- Leftward Shift Depiction: A decrease in supply, represented by a leftward shift, often occurs due to increased production costs or adverse environmental conditions.
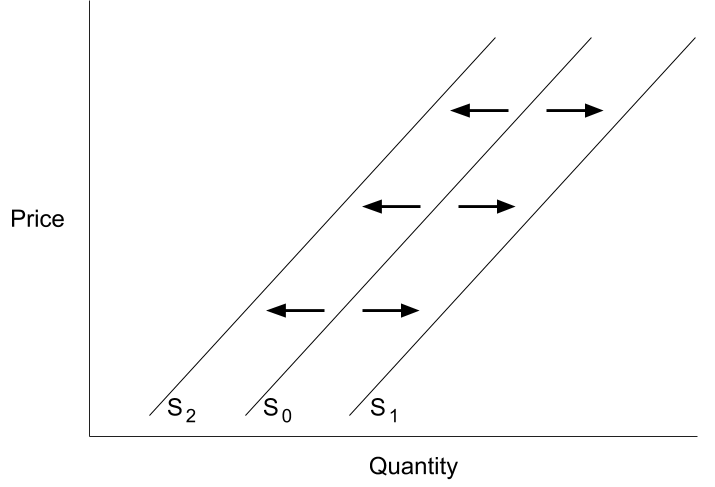
A graph illustrating the shifts in the supply curve.
Image courtesy of lumenlearning
Graphical Case Examples
- Technology-Induced Supply Increases: Graphs showing how advancements in technology have led to increased supply in various industries.
- Environmental Factors and Supply: Charts depicting how climatic changes and weather anomalies have resulted in reduced supply in sectors like agriculture and fisheries.
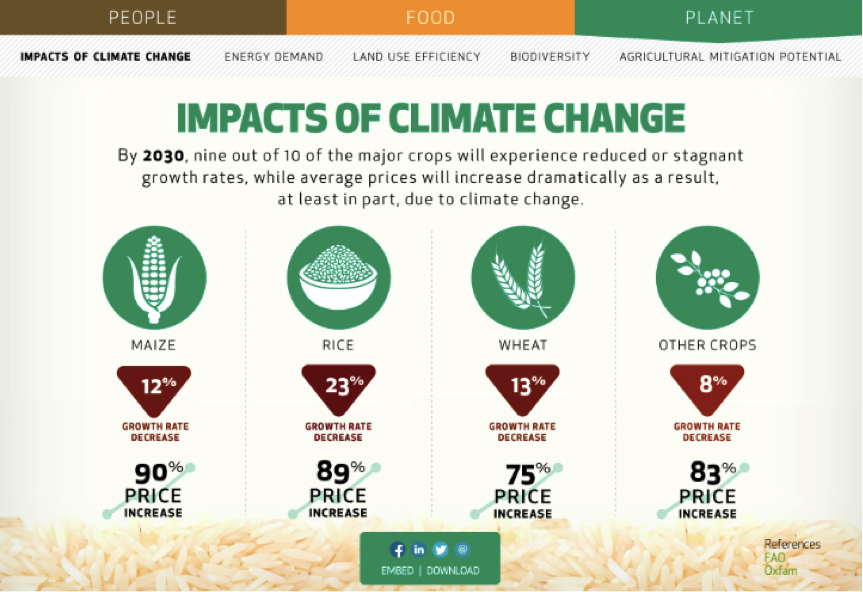
Image courtesy of cgiar
Understanding the nuances of supply curve shifts is essential for comprehending market dynamics. These shifts, caused by factors like technological advancements, input costs, and climatic conditions, shape the strategies of producers and influence market outcomes. The graphical analysis provides a clear visual representation of these shifts, helping students to conceptualize and analyze real-world economic scenarios more effectively. This knowledge is not just academically relevant but also equips students with practical tools to understand and predict market trends and behaviors.
FAQ
The availability of skilled labour is a crucial determinant of the supply curve for high-tech industries. In these sectors, skilled workers are essential for research, development, and production processes. When there is a sufficient pool of skilled labour, firms can expand their operations and produce more high-tech goods, leading to a rightward shift in the supply curve. Conversely, a shortage of skilled labour can restrict production capabilities, resulting in a leftward shift in the supply curve. Skilled labour is often a key factor in determining the competitiveness of high-tech industries in global markets, making it a critical driver of supply curve dynamics in these sectors.
Regulatory changes can have a profound impact on the supply curve in industries like pharmaceuticals. The introduction of new regulations, such as stricter quality standards or safety requirements, can increase production costs for firms. This can lead to a decrease in the quantity of pharmaceutical products supplied at each price level, resulting in a leftward shift in the supply curve. Conversely, regulatory reforms that reduce compliance burdens or streamline approval processes can lower production costs and encourage firms to supply more pharmaceuticals. This leads to a rightward shift in the supply curve, indicating an increase in the supply of pharmaceutical products in the market. Regulatory changes in industries with high compliance and safety standards can significantly influence supply curve dynamics and affect the availability of essential goods and services.
Government subsidies can impact the supply curve for agricultural products. When the government provides subsidies to farmers, it effectively reduces their production costs. This leads to an increase in the quantity of agricultural products supplied at various price levels, resulting in a rightward shift in the supply curve. Subsidies incentivize farmers to produce more, as they can maintain profitability even at lower market prices. As a result, the supply curve for agricultural products shifts to the right, indicating higher levels of supply in the market.
Changes in exchange rates can have a significant impact on the supply curve in an economy. When a country's currency depreciates relative to other currencies, its exports become cheaper for foreign buyers. This can lead to an increase in demand for the country's exports, resulting in an expansion of production to meet this increased demand. Consequently, the supply curve for export-oriented industries will shift to the right, reflecting higher levels of supply. Conversely, if a country's currency appreciates, its exports become more expensive for foreign buyers, potentially leading to a decrease in demand and a leftward shift in the supply curve for export industries.
Economies of scale can influence shifts in the supply curve by reducing production costs as firms increase their scale of operations. As firms grow and produce more, they can take advantage of cost-saving opportunities, such as bulk purchasing and specialized machinery. This results in lower average production costs, allowing firms to supply more goods at every price level. Consequently, the supply curve shifts to the right, indicating an increase in supply. Economies of scale are particularly significant in industries with high fixed costs, as spreading these costs over a larger quantity of output can lead to substantial cost reductions and supply curve shifts.
Practice Questions
A substantial increase in the minimum wage would lead to a leftward shift in the supply curve for a labour-intensive industry. This shift occurs because higher wages increase the production costs for firms. As a result, at each price level, firms are willing and able to supply a smaller quantity of goods, reflecting a contraction in supply. The impact is more pronounced in industries where labour costs constitute a major portion of total expenses. Consequently, the industry faces a decrease in overall supply, which is graphically represented by the supply curve shifting to the left.
Technological advancements in agriculture, such as the development of drought-resistant crops or more efficient farming equipment, would lead to a rightward shift in the supply curve. These innovations enhance production efficiency and yield, enabling farmers to produce more at a lower cost. In graphical terms, at each price level, the quantity supplied increases, indicating an expansion of supply. This is represented by the supply curve shifting to the right. The graphical analysis illustrates that for the same price, the market can now supply a greater quantity of agricultural products, showcasing the positive impact of technology on supply.
