
Statistical analysis in ecology is pivotal for interpreting complex data sets, offering insights into patterns and relationships within ecosystems. This section delves into chi-square tests and correlation coefficients, elucidating their roles, calculations, and applications in ecological studies.
Chi-Square Tests
Chi-square tests are instrumental in ecology, especially when dealing with categorical data. They assess the statistical significance of the observed distribution of data across different categories compared to what is expected under the null hypothesis.
Purpose and Application
Hypothesis Testing: Chi-square tests are primarily used for testing the independence or association between two categorical variables. They are pivotal in determining whether observed outcomes are significantly different from expected outcomes.
Observed vs Expected Frequencies: The core of the chi-square test lies in comparing observed frequencies with expected frequencies, offering insights into the significance of the observed distribution patterns.
Application in Ecology: Ecologists often employ chi-square tests to analyse data like plant species distribution across varied soil types or the occurrence of animal species in different habitats.
Steps in Conducting a Chi-Square Test
1. Collect Data: Data is gathered and often presented in a contingency table, showcasing the distribution of two categorical variables.
2. Calculate Expected Frequencies: The expected frequencies are calculated using the formula:
Expected frequency = (Row total * Column total) / Grand total
3. Compute Chi-Square Statistic: The chi-square statistic is calculated using:
X2= ∑ (O - E)2 / E
O = Observed frequency
E = Expected frequency
4. Determine Degrees of Freedom: The degrees of freedom are calculated as:
df = (Number of rows - 1) * (Number of columns - 1)
5. Find the P-Value: The chi-square statistic is compared to a chi-square distribution with the appropriate degrees of freedom to derive the p-value.
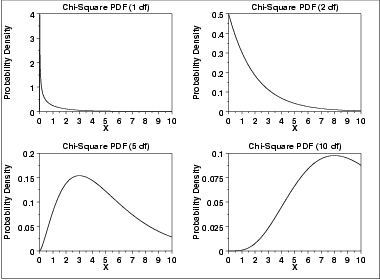
Probability density curves of the chi-square distribution for several degrees of freedom show how the shape changes with ν. This figure supports p-value lookup and interpretation after computing χ². Source.
6. Make a Decision: The null hypothesis is either rejected or not, based on the p-value and the chosen level of significance.
Example in Ecology
Scenario: An ecologist is studying if there’s a significant association between soil types and the presence of a specific plant species.
Data Collection: Data is collected from different plots, each having a distinct soil type, noting the presence or absence of the species.
Chi-Square Test Application: The test helps in determining if the observed distribution of the plant species across different soil types is by chance or signifies a significant association.
Correlation Coefficients
Correlation coefficients are vital in measuring the strength and direction of the linear relationship between two continuous variables. They are essential in ecology for understanding how different environmental factors and species are interrelated.
Types of Correlation Coefficients
Pearson’s r: This coefficient measures the linear correlation between two variables, with values ranging between +1 and -1, where +1 indicates a perfect positive linear relationship, -1 indicates a perfect negative linear relationship, and 0 signifies no linear correlation.
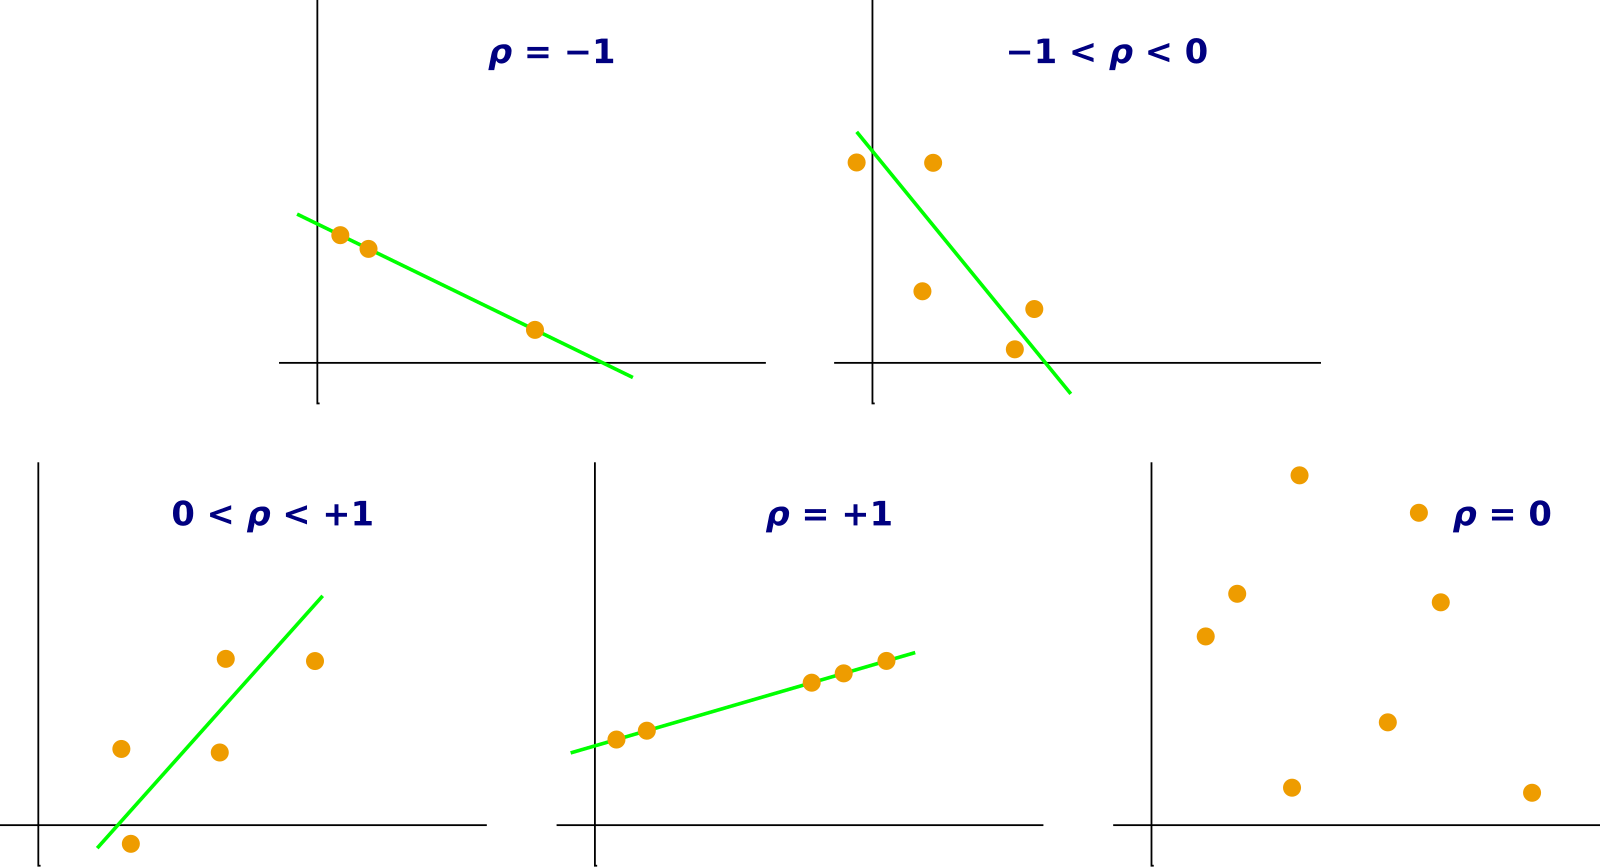
A set of scatterplots displays datasets with different Pearson correlation coefficients r, from strongly positive to strongly negative. It clarifies how the magnitude and sign of r relate to the visual tightness and slope of the data cloud. Source.
Spearman’s Rank Correlation: This is employed when the data isn’t normally distributed or the relationship isn’t linear. It ranks the data points and calculates the correlation based on these ranks.
Calculating Pearson’s r
1. Collect Data: Pairs of data for two continuous variables are collected.
2. Calculate Means: The means of both variables are computed.
3. Compute the Covariance and Variance: The covariance and variance are calculated using the formulas:
Covariance = ∑ (Xi-X) (Yi-Y)
Variance = ∑ (Xi-X)2 and (Yi-Y)2
4. Calculate Pearson’s r: Pearson’s r is calculated as:
r = Covariance / √Variancex * Variancey
Application in Ecology
Studying Relationships: Ecologists use correlation coefficients to study relationships between variables like temperature and species diversity, precipitation and plant growth, or altitude and animal distribution.
Interpreting Data: These coefficients are pivotal in interpreting data, making informed predictions, and understanding the intricate patterns and trends in ecology.
Example in Ecology
Scenario: An ecologist is examining the relationship between the average annual temperature and the number of plant species in different regions.
Data Collection: Data on the average annual temperature and the count of plant species in each region is collected.
Correlation Coefficient Calculation: The coefficient helps in determining the nature and strength of the relationship between temperature and plant species diversity.
Application in Ecology
Integrating Chi-Square Tests and Correlation Coefficients
Comprehensive Analysis: Utilising both chi-square tests and correlation coefficients ensures a thorough analysis of ecological data, offering insights into categorical and continuous data alike.
Enhanced Understanding: These statistical tools augment the comprehension of complex ecological systems, facilitating the identification of patterns, relationships, and interactions among various ecological elements.
Case Study: Analysing Bird Feeding Behaviour
Objective: An ecologist is keen to decipher the feeding behaviour of a bird species and its correlation with the availability of food resources.
Chi-Square Test: This test is employed to analyse the frequency of the birds feeding on different types of food, determining if there’s a preference.
Correlation Coefficient: It’s used to explore the relationship between the availability of a specific type of food and the frequency of the birds feeding on it.
Outcome: The combined application of chi-square tests and correlation coefficients offers a comprehensive view of the birds’ feeding behaviour and its association with food availability.
Practical Implications
Conservation Strategies: The insights derived from these statistical analyses are instrumental in formulating conservation strategies, habitat management, and biodiversity preservation efforts.
Policy Development: These analyses also play a crucial role in shaping environmental policies, ensuring they are grounded in scientific evidence and tailored for effective ecological conservation and sustainability.
Mastering chi-square tests and correlation coefficients equips students with vital tools for analysing and interpreting intricate ecological data. This foundation is essential for advanced ecological studies and real-world applications in the conservation and management of ecosystems. The nuanced understanding of these statistical tools is not just academically enriching but also practically applicable in various ecological and environmental conservation scenarios.
FAQ
For non-linear relationships in ecological data, Pearson’s correlation coefficient is not appropriate as it measures linear relationships. Instead, you can use Spearman’s rank correlation, which does not assume linearity and is based on the ranked values of the data rather than their actual values. Alternatively, more advanced statistical methods like polynomial regression or non-parametric tests can be employed to analyse and interpret non-linear relationships in ecological data. These methods allow for a more flexible approach to understanding complex, non-linear interactions between ecological variables, offering nuanced insights into ecosystem dynamics and processes.
When using a chi-square test in an ecological study, several assumptions must be met to ensure the validity of the test results. The data should be categorical, and the observations should be independent, meaning that the occurrence of an event in one category does not influence the occurrence in another. Additionally, the expected frequency for each category should typically be five or more to apply the chi-square test validly. Meeting these assumptions is crucial to ensure that the chi-square test provides accurate and reliable insights into the relationships between categorical variables in ecological contexts.
One common mistake is neglecting the assumptions of the chi-square test, such as the requirement for sufficient expected frequencies in each category. Ignoring this can lead to inaccurate conclusions. Another error is misinterpreting the p-value. A low p-value indicates that the observed data is inconsistent with the null hypothesis, but it does not measure the probability that the null hypothesis is true or false. Also, avoid over-relying on the p-value alone; consider the context, effect size, and other relevant factors to draw comprehensive conclusions about ecological relationships and patterns.
Correlation coefficients measure the strength and direction of a relationship between two variables but do not establish causality. A high correlation, whether positive or negative, indicates a strong association but does not prove that changes in one variable cause changes in another. In ecological studies, establishing causality requires controlled experiments, additional statistical analyses, or comprehensive observational studies to rule out confounding variables and biases. It’s crucial to remember the adage, “correlation does not imply causation,” to avoid misinterpreting results and making unsupported claims about ecological relationships and processes.
The significance level, often denoted by alpha (α), is a threshold set before conducting a chi-square test to decide whether to reject the null hypothesis. It represents the probability of rejecting the null hypothesis when it is true. Commonly used significance levels are 0.05, 0.01, and 0.10. The choice depends on the context of the study and the level of confidence you want to have in your results. A lower α value indicates a higher confidence level. In ecological studies, a 0.05 significance level is often used, meaning that there is a 5% chance of rejecting the null hypothesis if it is true.
Practice Questions
A chi-square test is used in ecology to determine if there is a significant association between two categorical variables. For instance, in a study exploring the relationship between different types of soil (sandy, clay, loamy) and the presence of a specific plant species, the chi-square test would compare the observed frequency of the plant species in each soil type to the expected frequency if there was no association. The test calculates the chi-square statistic and compares it to a critical value, considering the degrees of freedom, to decide whether to reject the null hypothesis of no association.
Correlation coefficients, particularly Pearson’s r, could be instrumental in this study to quantify the strength and direction of the relationship between average annual rainfall and plant species diversity. A positive correlation coefficient, for example, 0.8, would indicate a strong positive linear relationship between these two variables. This means as the average annual rainfall increases, the diversity of plant species also increases proportionally. The ecologist could use this information to predict plant diversity based on rainfall data, aiding in ecological planning and conservation efforts, and understanding the impact of climatic factors on biodiversity.
