
Community structure is an integral aspect of ecosystems, encompassing the diversity and distribution of species within a specific environment. It serves as a foundational element in ecological studies, offering insights into the complexity, stability, and health of ecosystems. Understanding the niche and habitat of species is essential for comprehending their role within their community.
Species Richness
Species richness denotes the total number of distinct species present within a defined ecological community or habitat. It provides a quantitative measure that reflects the diversity of species but does not account for the abundance of each species.
Importance
Biodiversity Enhancement: A higher species richness is synonymous with increased biodiversity. Each species contributes to the overall functionality and resilience of the ecosystem, enhancing its ability to withstand environmental changes and disturbances. The presence of keystone species can significantly influence community structure and species richness.
Ecosystem Services Augmentation: Richer ecosystems are known to offer a plethora of services. These include enhanced pollination, increased soil fertility, and improved water purification, each contributing to the overall health of the environment and benefiting human populations. This is particularly evident in diverse biomes around the world.
Measurement Techniques
Direct Count: This method involves the meticulous identification and counting of each distinct species within a given area. It is often employed in smaller, manageable ecosystems.
Sampling and Extrapolation: In larger, more complex ecosystems, sampling is used. Specific areas are studied, and the results are then extrapolated to estimate the total species richness of the entire ecosystem.
Influencing Factors
Environmental Conditions: Elements such as resource availability, climate, and habitat complexity are pivotal. For instance, a diverse habitat with abundant resources typically supports a higher number of species.
Geographical Location: Certain locations, especially tropical regions, are renowned for their high species richness due to favourable environmental conditions, including optimal temperatures and abundant rainfall.
Species Evenness
Species evenness is a measure that reflects the uniformity in the distribution of individuals among the different species within an ecosystem. It complements species richness by adding a layer of depth, focusing on the population distribution of each species.
Importance
Ecosystem Stability: An ecosystem with high species evenness is often more stable. It indicates a balanced distribution of species, reducing the dominance of any single species and promoting ecological harmony. The distribution of species can often be influenced by various symbiotic relationships that occur within the ecosystem.
Resource Utilisation Efficiency: High evenness signifies that resources within the ecosystem are utilised efficiently, with reduced competition among species, promoting coexistence.
Measurement
Pielou’s Evenness Index: This index is calculated using a formula that provides a score between 0 and 1. A score of 1 indicates perfect evenness, where each species has an equal number of individuals.
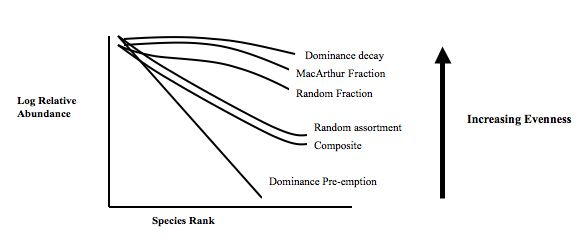
Rank–abundance (Whittaker) curves illustrating that flatter curves indicate higher evenness and steeper curves indicate dominance by a few species. Model names are included for context, but only the relationship between slope and evenness is required here. Source.
Influencing Factors
Resource Availability: The distribution and abundance of resources play a pivotal role. In an ecosystem with evenly distributed resources, species evenness is typically higher.
Environmental Stress: Ecosystems under stress often exhibit low species evenness as certain resilient species dominate while others diminish.
Biodiversity Indices
Biodiversity indices are comprehensive metrics that integrate species richness and evenness to offer a holistic view of biodiversity. They are instrumental in ecological assessments, conservation planning, and environmental monitoring.
Shannon-Wiener Index
Calculation: The index is derived from a formula that incorporates both the number and abundance of species. It is expressed as H' = -Σ (p_i * ln p_i), where p_i represents the proportion of individuals of a specific species to the total number of individuals.
Interpretation: A higher value of the Shannon-Wiener Index signifies greater biodiversity, reflecting both the diversity and even distribution of species.
Simpson’s Diversity Index
Calculation: This index measures the probability that two randomly selected individuals belong to the same species. It is calculated using the formula D = Σ (n_i * (n_i - 1)) / (N * (N - 1)), where n_i is the total number of organisms of a particular species and N is the total number of organisms of all species.
Interpretation: Values closer to 1 indicate higher diversity, showcasing a rich and evenly distributed species population.
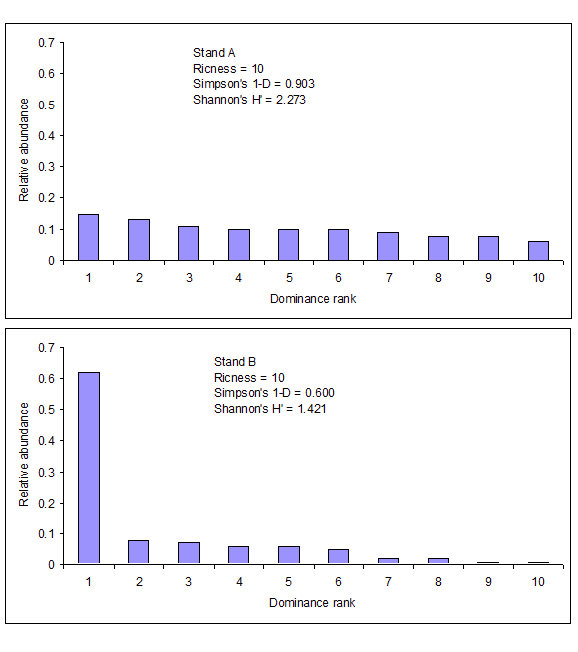
Comparison of two communities illustrating how Shannon–Wiener (H′) and Simpson’s (D) capture both richness and evenness when assessing diversity. Use it to connect index values to visible differences in community structure. Source.
Factors Influencing Biodiversity Indices
Habitat Diversity: Varied habitats support a plethora of species, leading to higher biodiversity indices. The structural complexity and availability of diverse microhabitats enhance species accommodation. Understanding the different types of ecosystems and services can provide further insight into how various ecosystems function and are valued.
Human Activities: Actions such as pollution, deforestation, and urbanisation can adversely impact biodiversity. Monitoring changes in biodiversity indices helps in assessing the extent of human-induced environmental changes.
Applications in Conservation
The intricate understanding of community structure is pivotal for effective conservation. It aids in the identification of biodiversity hotspots, assessment of human impact, and formulation of targeted restoration strategies.
Identifying Biodiversity Hotspots
Data Collection: Comprehensive data on species richness, evenness, and biodiversity indices is gathered. This data serves as a cornerstone for identifying areas teeming with biodiversity.
Conservation Priorities: Resources and conservation efforts are strategically allocated to safeguard areas identified as biodiversity hotspots, ensuring the preservation of unique and diverse species.
Assessing Human Impact
Baseline Data: Historical data serves as a benchmark for comparative analysis, enabling the assessment of changes in community structure over time.
Impact Analysis: The evaluation encompasses the effects of various human activities, including pollution, habitat loss, and climate change, on biodiversity indices and overall ecosystem health.
Restoration Efforts
Targeted Actions: Based on the insights gleaned from the assessment of community structure, targeted actions are implemented to restore species richness and evenness. These efforts are tailored to address specific challenges and threats identified in diverse ecosystems.
Monitoring and Adaptation: Post-implementation, regular monitoring ensures that the effectiveness of restoration efforts is assessed. Data on community structure is continually analysed, and strategies are adapted to optimise outcomes and enhance ecosystem resilience.
In delving into the nuances of species richness, species evenness, and biodiversity indices, students are equipped with the foundational knowledge to explore, appreciate, and contribute to the intricate world of ecosystems and ecology. These concepts serve as a gateway to understanding the dynamic interplay of diverse species within varied ecosystems, laying the groundwork for informed conservation and restoration initiatives.
FAQ
Yes, human conservation efforts can sometimes artificially inflate species richness and evenness. For example, reintroducing species that were previously extinct in the wild or introducing new species to enhance biodiversity can increase species richness. However, this might not always reflect a natural diversity. Similarly, conservation actions like controlled burns or habitat restoration can promote the growth of certain species, impacting species evenness. While these efforts aim to restore or enhance ecosystems, it’s essential to consider the natural ecological processes and ensure that interventions align with the intrinsic balance and dynamics of the ecosystems.
Habitat fragmentation often leads to a reduction in species richness and evenness. As habitats become isolated, smaller populations of species are confined to disconnected patches of land. This isolation can lead to a decrease in genetic diversity and increase the vulnerability of species to extinction. Species richness declines as certain species, especially those requiring larger territories or specific habitats, are unable to survive. Species evenness is also affected, as the fragmented habitats can lead to an imbalance in species populations, with some becoming overly dominant while others decline, disrupting the natural balance of the ecosystem.
Two different ecosystems can have the same species richness but different levels of biodiversity due to variations in species evenness and other ecological factors. While species richness accounts for the number of different species present, it doesn’t consider the population distribution of these species. One ecosystem might have a balanced population distribution among species (high evenness), while the other might be dominated by a few species (low evenness). Additionally, genetic diversity within species and the complexity of ecological interactions also contribute to overall biodiversity, leading to disparities in the biodiversity levels of the two ecosystems despite similar species richness.
Climate change can significantly impact species richness and evenness in ecosystems. As global temperatures rise, certain species may find their native habitats inhospitable, leading to a decline in species richness. For instance, temperature-sensitive species might face extinction if they cannot migrate to cooler areas. Additionally, climate change can disrupt species evenness by favouring species that are more resilient to temperature fluctuations, leading to their dominance and a decrease in overall evenness. This imbalance can affect ecosystem functions and services, as the decline in diversity can reduce the ecosystem's resilience to disturbances and its ability to support various life forms.
Invasive species can dramatically alter community structure. They often possess characteristics that allow them to outcompete native species, leading to a decline in species richness. As invasive species proliferate, they monopolise resources, resulting in decreased availability for native species and a subsequent decline in their populations. This imbalance also affects species evenness, as the invasive species become overly dominant. The overall biodiversity indices are impacted, reflecting a decline in both the variety and equitable distribution of species within the ecosystem. This alteration in community structure can lead to reduced ecosystem functionality and resilience.
Practice Questions
Biodiversity indices, including the Shannon-Wiener and Simpson’s Diversity Index, integrate species richness and evenness to offer a holistic biodiversity perspective. The Shannon-Wiener Index considers the number and abundance of species, with higher values indicating increased biodiversity. It reflects not just the variety, but also how evenly species are distributed. Simpson’s Diversity Index calculates the probability that two randomly selected individuals belong to the same species. A higher value signifies greater diversity and even distribution. These indices are instrumental in ecological assessments, offering nuanced insights into ecosystem health, complexity, and resilience.
Species richness and species evenness are fundamental in evaluating an ecosystem's biodiversity. Species richness provides insights into the variety of species present, offering a snapshot of diversity. It is crucial for understanding the range of organisms and their potential contributions to ecosystem processes and resilience. On the other hand, species evenness assesses the distribution of individuals among those species. A balanced distribution indicates a healthy, stable ecosystem where no single species dominates, ensuring a variety of ecological roles are fulfilled. Together, they offer a comprehensive view of biodiversity, aiding in conservation and management efforts.
