
IB Syllabus focus:
'- Investigating the relationship between temperature, pressure, and volume for a fixed mass of an ideal gas and analyzing graphs relating these variables.
- Understanding that the names of specific gas laws will not be assessed.
- Discussing the presentation of graphs as sketches or accurately plotted data points, and the advantages and limitations of each.
- Noting the value for the molar volume of an ideal gas under standard temperature and pressure (STP) from the data booklet.'
The fascinating world of gases entails understanding how variables such as temperature, pressure, and volume interplay. In the context of ideal gases, which are hypothetical gaseous substances with simplified interactions, these relationships become more intriguing. This segment delves into the relationships and graphical representations concerning ideal gases.
Relationship between Temperature, Pressure, and Volume
When considering a fixed mass of an ideal gas:
Temperature and Volume (Charles’s Law): If pressure remains constant, the volume of an ideal gas is directly proportional to its absolute temperature. This implies that as the temperature increases, the volume of the gas expands proportionally.
Charles’s Law (V/T) = constant
V = Volume of the gas (litres, L)
T = Absolute temperature (kelvin, K)
Pressure and Volume (Boyle’s Law): For a constant temperature scenario, the pressure of an ideal gas is inversely proportional to its volume. This means that as the volume decreases, the pressure increases and vice versa.
Boyle’s Law (P × V) = constant
P = Pressure of the gas (kilopascals, kPa)
V = Volume of the gas (litres, L)
Pressure and Temperature (Gay-Lussac’s Law): With volume held constant, the pressure of an ideal gas directly correlates with its absolute temperature. As temperature rises, so does the pressure.
Gay-Lussac’s Law (P/T) = constant
P = Pressure of the gas (kilopascals, kPa)
T = Absolute temperature (kelvin, K)
It's worth noting that while specific gas laws have names associated with them, for the purposes of this curriculum, the names of these laws won't be assessed.
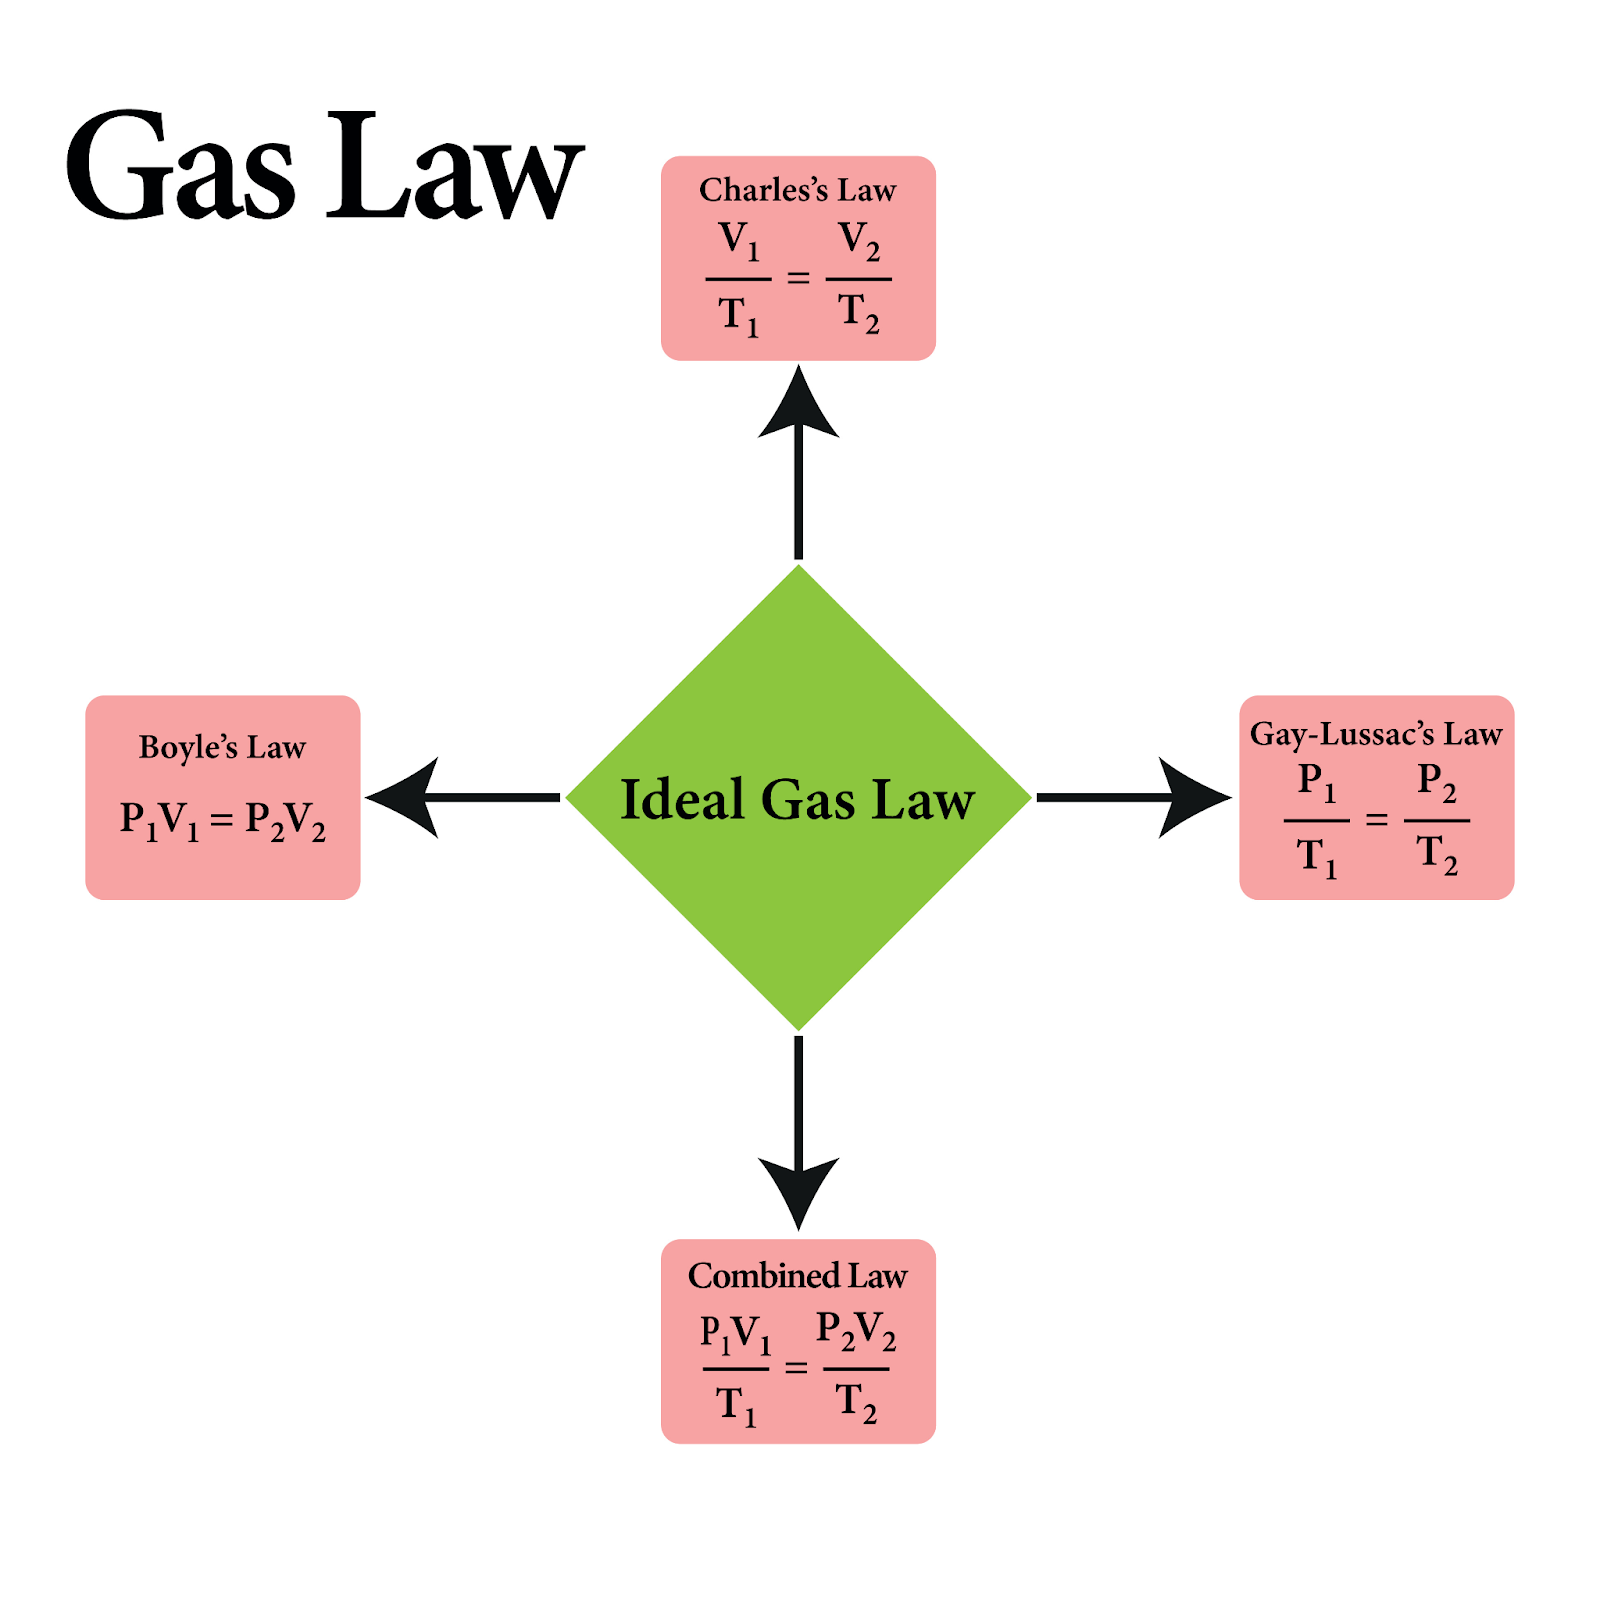
Image courtesy of HaqueMukul
Graphical Analysis of Gas Variables
Analysing relationships between variables often benefits from graphical representations. Graphs offer a visual means to comprehend the intricacies of the interplay between temperature, pressure, and volume.
Sketches vs Accurate Plots:
Sketches: These are rough representations and may not include specific data points. However, they're useful for understanding general trends or behaviours.
Accurately Plotted Data Points: These are precise, offering specific values for each variable. They're essential when exact values or detailed analysis is needed.
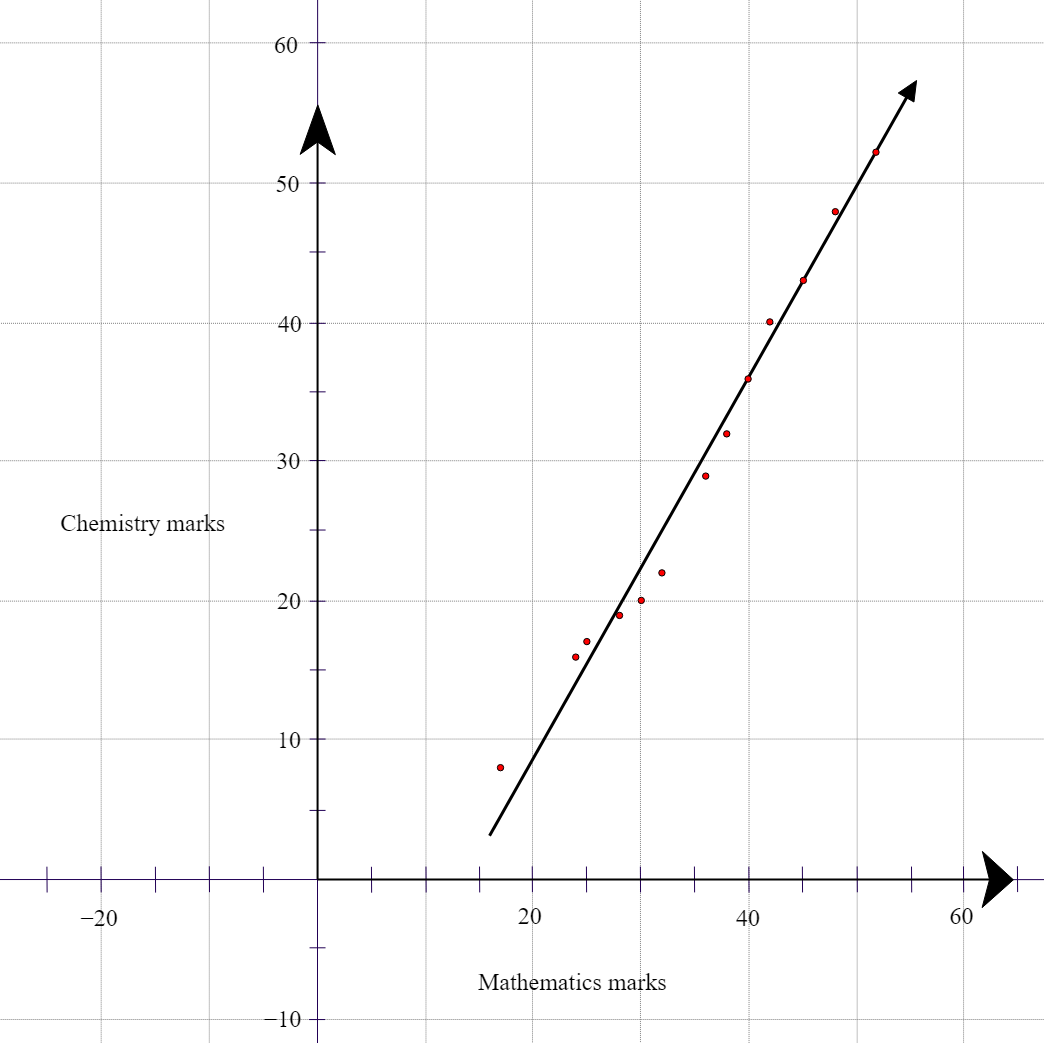
Image courtesy of Adrignola
Advantages and Limitations:
Sketches:
Advantages: Quick to draw and easy to understand the general trend.
Limitations: Lacks precision and specific data points.
Accurately Plotted Data Points:
Advantages: Precise and provides an exact relationship between variables.
Limitations: Can be time-consuming to plot and may clutter if too many data points are presented.
Molar Volume of an Ideal Gas at STP
For an ideal gas, the molar volume under standard temperature and pressure (STP) is a constant value. It's essential to refer to the provided data booklet for the exact value. Under STP conditions (0°C and 100 kPa), the molar volume for any ideal gas is approximately 22.71 litres per mole. This uniformity simplifies calculations and provides a baseline for understanding the behaviour of real gases under similar conditions.
Molar Volume (at STP): The volume occupied by one mole of an ideal gas at standard temperature (0 °C) and standard pressure (100 kPa), equal to approximately 22.71 L mol⁻¹.
Practice Questions
The graph showcases a direct relationship between the volume of a gas and its temperature when the pressure is constant. As the temperature increases, the volume of the gas also increases proportionally. This relationship is consistent with Charles's Law, which states that the volume of an ideal gas is directly proportional to its absolute temperature, provided the pressure remains unchanged.
Sketches, being rough representations, are quick to draw and readily convey general trends or behaviours of gases, making them effective for quick insights. However, they lack precision and might not provide specific data points, which can be a limitation when detailed analysis is required. On the other hand, graphs with accurately plotted data points are precise, offering exact relationships between variables. They are essential when one needs to refer to specific values or carry out detailed analysis. Nevertheless, these graphs can be time-consuming to produce and may appear cluttered if too many data points are presented, making it challenging to discern trends at a glance.
FAQ
The use of an absolute temperature scale, like Kelvin, is crucial because gas laws are based on proportional relationships. Using the Celsius scale could yield negative values, making proportional calculations (like volume divided by temperature) nonsensical. The Kelvin scale starts at absolute zero, ensuring that all temperatures are positive, making proportional relationships meaningful. Moreover, absolute zero in the Kelvin scale has physical significance as the point where particles have minimum thermal motion.
At extremely low temperatures, real gases deviate significantly from the predictions made by the ideal gas laws. This is because, at very low temperatures, the kinetic energy of the gas molecules is reduced, causing them to move slower. As a result, intermolecular forces become more pronounced. These forces can cause the gas molecules to attract each other and condense into a liquid or solid state. In contrast, an ideal gas, by definition, would not have these intermolecular forces and would not condense, no matter how low the temperature goes.
No gas behaves perfectly as an ideal gas in all conditions. However, many gases come close to ideal behaviour under conditions of low pressure and high temperature. At low pressures, the volume of the gas particles becomes negligible compared to the space between them, and intermolecular forces are minimal. At high temperatures, the kinetic energy of the gas particles is high, reducing the effects of intermolecular attractions. Hence, under such conditions, real gases can be approximated as ideal gases, making the ideal gas laws applicable for practical purposes.
The linear relationship between volume and temperature for an ideal gas at constant pressure is a manifestation of Charles's Law. This law states that the volume of a gas is directly proportional to its absolute temperature (measured in Kelvin). The slope of such a graph represents the volume's rate of change with respect to temperature. The steeper the slope, the greater the change in volume for a unit change in temperature. It's essential to note that this linearity is only observed when temperature is plotted on an absolute scale, like Kelvin.
Absolute zero, equivalent to 0 Kelvin, is theoretically the lowest possible temperature where particles have minimum thermal motion. In the context of gas laws, particularly Charles's Law, if you extrapolate the volume-temperature graph, the volume of an ideal gas would become zero at absolute zero. However, in reality, real gases liquefy or solidify before reaching this point. Thus, absolute zero underlines the temperature at which an ideal gas would have zero volume, but this is a theoretical concept as real gases behave differently.
