Understanding how to represent and interpret inequalities is crucial in algebra. This skill allows us to visually depict the range of possible values that satisfy an inequality. Through the use of number lines and specific symbols, we can express complex relationships between variables and constants in a simple, understandable format.
Introduction to Inequalities
Inequalities are mathematical expressions that describe the relative size or order of two items. They are essential in various fields of maths and science, helping us define boundaries and conditions that do not have exact values but rather fall within a range.
Types of Inequalities
Inequalities can be strict or inclusive:
- Strict Inequalities do not include the endpoint values. They are represented by (less than) and (greater than).
- Inclusive Inequalities include the endpoint values. They are represented by (less than or equal to) and (greater than or equal to).
Representing Inequalities on a Number Line
A number line is a visual tool that helps us represent and understand the concept of inequalities.
Open and Closed Circles
- Open circles represent strict inequalities ( or ). They indicate that the endpoint is not included in the range.
- Closed circles represent inclusive inequalities . They indicate that the endpoint is included in the range.
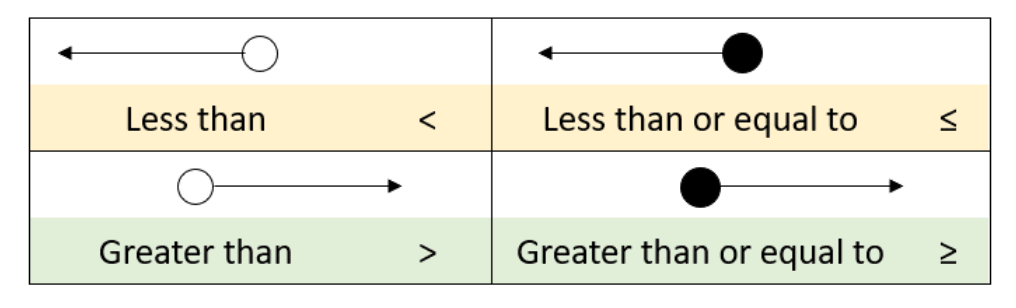
Image courtesy of Math Salamander
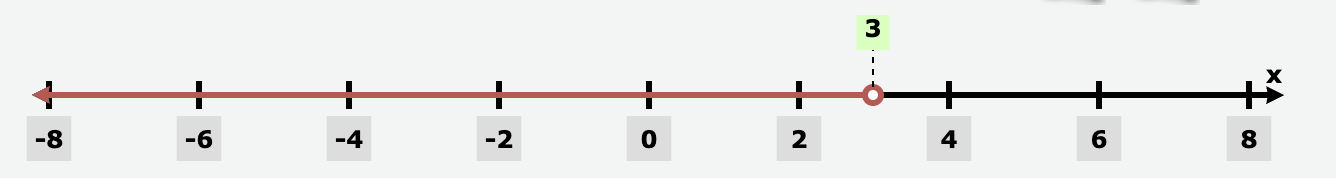
Example 1: Representing a Strict Inequality
Consider the inequality .
1. Draw a number line.
2. Place an open circle at 3 to indicate that 3 is not included.
3. Shade the line to the left of 3, indicating all values less than 3 are included.
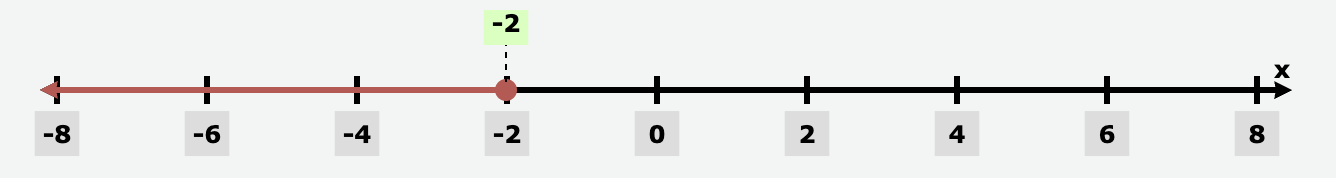
Example 2: Representing an Inclusive Inequality
Consider the inequality .
1. Draw a number line.
2. Place a closed circle at -2 to indicate that -2 is included.
3. Shade the line to the left of -2, including all values less than or equal to -2.
Practical Application
Representing inequalities on a number line allows us to easily visualize and solve problems involving ranges of values.
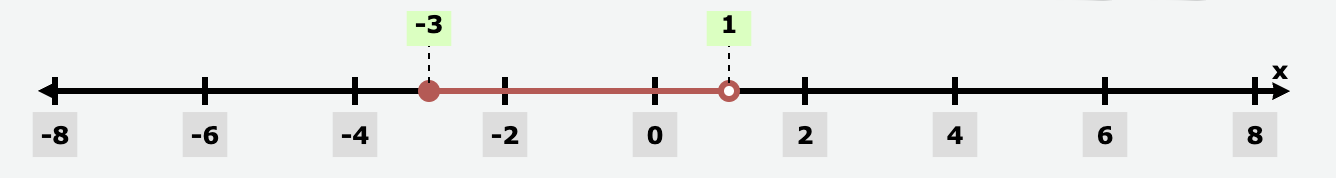
Example 3: Multiple Inequalities
Consider representing the compound inequality on a number line.
1. Draw a number line.
2. For , place a closed circle at -3 and shade to the right.
3. For , place an open circle at 1 and make sure the shading stops at this point.
4. The overlap of these two conditions on the number line shows the range of .