
Fundamentals of Displacement-Time Graphs
These graphs represent an object's displacement from a point over time, offering insights into its motion characteristics.
The Role of Gradient
- Defining Gradient: In displacement-time graphs, the gradient or slope at any point is the instantaneous velocity of the object at that time.
- Calculating Gradient: To calculate the gradient, draw a tangent to the curve at the point of interest and use the slope formula: Slope = Change in Displacement (Δy) / Change in Time (Δx).
Detailed Steps for Gradient Calculation
- Tangent Line: At the chosen point on the curve, draw a tangent line, ensuring it lightly touches the curve without intersecting it.
- Select Points on Tangent: Pick two distinct points on the tangent line and determine their coordinates.
- Compute Slope: Apply the slope formula using the coordinates of the two points. This slope represents the instantaneous velocity at that point.
Interpreting Different Gradients
The gradient of a displacement-time graph varies, indicating different types of motion.
Types of Gradients and Their Implications
- Steep Gradient: Suggests a high velocity. The steeper the slope, the faster the object's motion.
- Shallow Gradient: Indicates slower motion. A nearly flat line implies minimal movement.
- Horizontal Line: Represents no displacement change over time, meaning the object is stationary.
- Negative Gradient: Implies the object is moving in the opposite direction to the initial motion, returning towards its starting point.
Slope Interpretation in Displacement-Time Graphs
Understanding the slope in these graphs is key to analysing motion.
Positive vs Negative Slope
- Positive Slope: Signifies forward movement from the starting point.
- Negative Slope: Indicates reverse movement or returning towards the starting point.
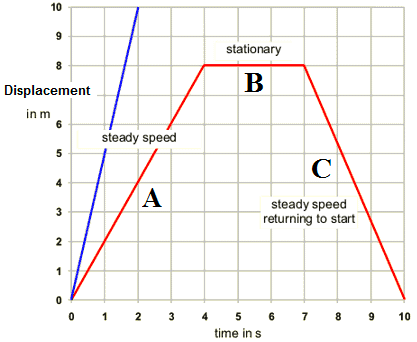
Gradient of displacement-time graph
Image Courtesy Ben Himme, Tristan O'Hanlon
Effect of Curvature on Velocity
Curvature in displacement-time graphs reveals vital information about velocity changes.
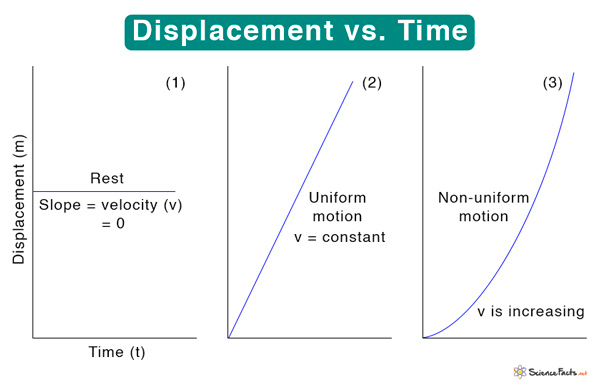
Displacement-time graph
Image Courtesy Science Facts
Analysis of Curved Lines
- Uniform Curvature: Suggests consistent acceleration or deceleration.
- Varying Curvature: Indicates changing rates of acceleration, pointing to more complex motion scenarios.
Advanced Interpretations
Beyond the basics, these graphs can be used for more nuanced motion analysis.
Non-linear Motion
- Increasing Curvature: Shows increasing acceleration. The steeper the curve becomes, the faster the acceleration.
- Decreasing Curvature: Indicates decreasing acceleration or increasing deceleration.
Problem Solving with Graphs
These graphs are instrumental in solving a range of physics problems, particularly those involving kinematic equations and motion analysis.
FAQ
A parabolic curve on a displacement-time graph typically indicates that the object is undergoing uniformly accelerated motion. In such cases, the curvature of the graph suggests a constant rate of acceleration. The parabolic nature of the graph is characteristic of motions like free-falling objects under gravity, where acceleration remains constant (gravity's pull). The steeper the curve becomes as time progresses, the greater the acceleration. Conversely, if the parabolic curve opens downwards, it suggests a uniformly decelerating motion, where the object gradually decreases its velocity at a constant rate.
The steepness, or the slope, of a displacement-time graph directly correlates with the speed of the object. A steeper slope signifies a higher speed, as the object covers more displacement in a shorter amount of time. Conversely, a flatter slope indicates a lower speed, as the object covers less displacement over the same time period. Essentially, the angle of the slope with respect to the time axis gives an indication of the object's speed: the sharper the angle, the greater the speed, and vice versa. This relationship is crucial for analysing motion in a variety of contexts.
Yes, displacement-time graphs can show retrograde motion, which is motion in the opposite direction to the initial movement. This is represented by the graph sloping downwards. When the slope of the graph becomes negative, it indicates that the object is moving back towards its starting point. This change in direction results in the displacement decreasing over time. In such graphs, the point where the slope changes from positive to negative marks the instant where the object stops moving forward and starts moving backwards, effectively showing a reversal in motion direction.
A horizontal section in a displacement-time graph occurs when the object is stationary. During this phase, the object's displacement does not change with time, indicating no movement. Such scenarios can occur when an object is at rest or has come to a stop after moving. For instance, a car pausing at a traffic light would show as a horizontal line on the graph for the duration of the stop. The length of the horizontal section gives the duration of the stationary period. After this phase, if the object starts moving again, the graph will slope upwards or downwards, depending on the direction of motion.
On a displacement-time graph, linear motion is represented by a straight line, whereas non-linear motion is depicted by a curved line. In linear motion, the slope of the line (which represents velocity) is constant, indicating a uniform velocity. This means the object moves equal distances in equal time intervals. In contrast, a curved line in a non-linear motion graph indicates that the velocity of the object is changing. The curve may either get steeper (accelerating motion) or less steep (decelerating motion) as time progresses. The curvature of the line reflects the rate at which velocity changes, signifying acceleration or deceleration.
Practice Questions
The average velocity can be determined from the slope of the displacement-time graph. For a straight line, the slope is constant and equals the average velocity. The slope (average velocity) is calculated as the change in displacement divided by the change in time. Here, the change in displacement (Δd) is 100 m and the change in time (Δt) is 10 s. Therefore, the average velocity (v) = Δd / Δt = 100 m / 10 s = 10 m/s. Thus, the object's average velocity over the 10-second period is 10 m/s.
The curve becoming steeper over time on a displacement-time graph indicates that the object's velocity is increasing. The steepening curve signifies that the displacement of the object is increasing at a faster rate as time progresses. This also implies that the object is accelerating, as acceleration is the rate of change of velocity with time. A curve that gets steeper signifies not just an increase in velocity but also an increase in the rate at which the velocity is changing, which is the definition of acceleration in physics.
