
Hydrographs are essential tools in hydrology, offering a visual representation of how rivers and streams respond to rainfall. They are particularly useful in understanding the dynamics of river flow, aiding in effective water resource management, flood forecasting, and environmental protection. This section delves into the critical components of storm and annual hydrographs, providing an in-depth analysis essential for CIE A-Level Geography students.
Storm Hydrographs
Storm hydrographs are graphical representations of the flow rate (discharge) in a stream or river in response to a specific rainfall event. They are pivotal in understanding the immediate hydrological response of a drainage basin to precipitation.
Peak Discharge
- Definition: Peak discharge is the highest flow rate recorded on the hydrograph following a storm.
- Significance: It is crucial for assessing the potential for flooding and for designing flood-prevention measures.
Lag Time
- Definition: Lag time is the duration between the peak rainfall and peak discharge.
- Factors Influencing Lag Time: Urbanisation, soil type, and land use can significantly alter lag time, with urban areas typically showing shorter lag times due to faster surface runoff.
Rising and Falling Limbs
- Rising Limb: This part of the hydrograph shows a rapid increase in discharge following a rainstorm. It indicates how quickly the river responds to rainfall.
- Falling Limb: The falling limb illustrates the rate at which the river returns to its normal level. A steep falling limb indicates a quick drainage basin response.
Recession Curve
- Description: The recession curve is the part of the hydrograph that returns to base flow conditions after the peak discharge.
- Importance: It helps in understanding the base flow contribution from groundwater and the overall drainage capacity of the basin.
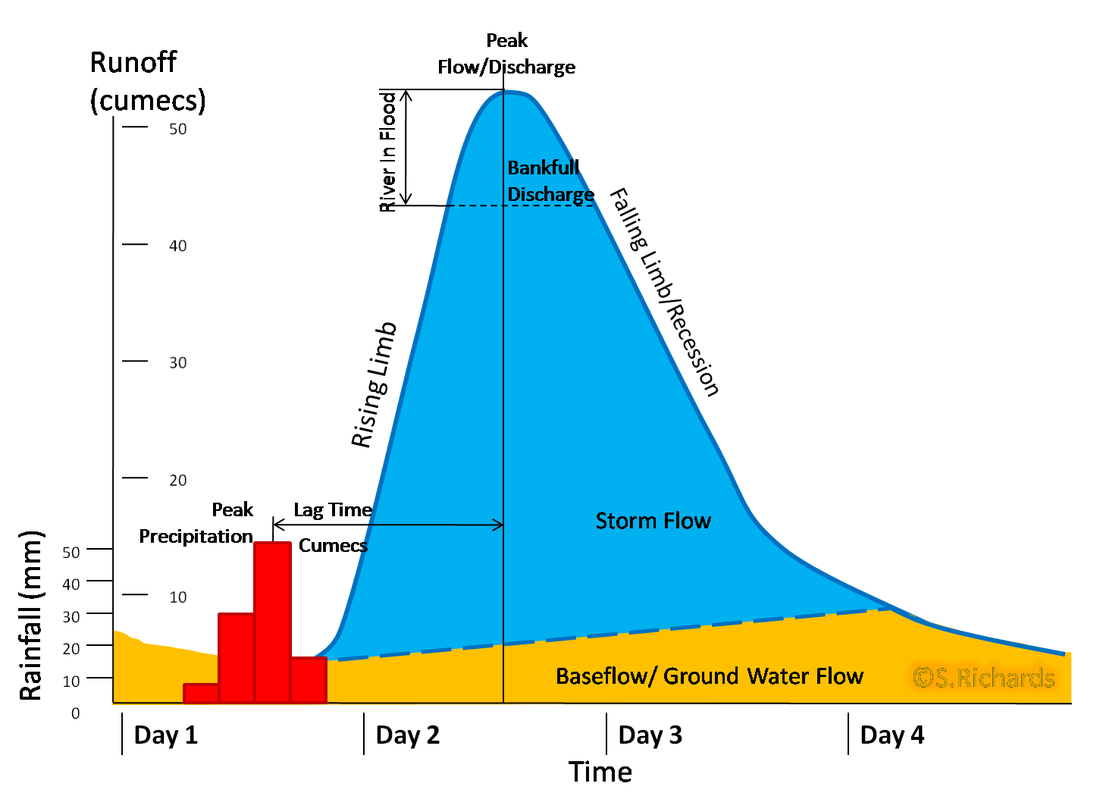
Image courtesy of alevelrivers.weebly.com
Annual Hydrographs
Annual hydrographs depict the flow variation within a river over a year, highlighting the impact of seasonal changes on river systems.
Seasonal Variations
- Overview: These variations are influenced by climatic factors such as precipitation, temperature, and evapotranspiration.
- Examples: In temperate climates, higher winter rainfall leads to higher winter discharges. In contrast, snowmelt in spring can significantly increase discharge in alpine regions.
Base Flow
- Explanation: Base flow is the regular, sustained contribution to a river's discharge from sources like groundwater and delayed throughflow.
- Role: It maintains river ecosystems during dry periods and is a critical factor in water resource management.
Direct Runoff
- Definition: Direct runoff is the portion of river flow that enters the river channel directly from the surface.
- Impact: This component is highly responsive to rainfall intensity and significantly affects the river's discharge during and immediately after rainfall events.
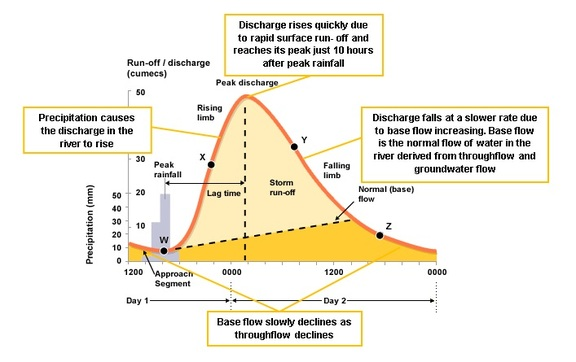
Image courtesy of thebritistgeographer.weebly.com
Graphical Analysis
Interpreting hydrographs is a key skill in geography, offering insights into the hydrological behaviour of catchments.
Interpreting Hydrograph Components
- Techniques: Analysis involves examining the shape and features of the hydrograph to deduce information about the catchment characteristics.
- Application: For example, a short lag time and a high peak discharge suggest an urbanised catchment with impermeable surfaces.
Hydrological Response Insights
- Understanding Catchment Characteristics: Factors like catchment size, shape, and land use can be inferred from hydrograph shapes.
- Predictive Use: Hydrographs are used to predict river responses to future rainfall events, crucial for flood risk management and environmental planning.
FAQ
Antecedent moisture, the moisture present in the soil before a rain event, plays a crucial role in shaping a hydrograph. When the soil is already saturated from previous rainfall, its capacity to absorb more water is greatly reduced. This condition leads to increased surface runoff, as excess water cannot infiltrate into the ground. Consequently, the hydrograph of a river flowing through a saturated basin will typically have a shorter lag time and a higher peak discharge, indicating a more immediate and intense response to rainfall. Conversely, in conditions of low antecedent moisture, where the soil is dry and has a higher infiltration capacity, the hydrograph will show a longer lag time and a lower peak discharge. This scenario reflects the soil's ability to absorb a significant portion of the rainfall, reducing the volume and speed of surface runoff. Understanding antecedent moisture conditions is essential for predicting river responses to storm events, particularly in flood forecasting and management.
Vegetation significantly influences the characteristics of a hydrograph through various processes. Dense vegetation cover can reduce the speed and volume of surface runoff, leading to a more moderated and delayed peak discharge. This is primarily due to the interception of rainfall by leaves and stems, which slows down the movement of water to the ground and promotes evaporation back into the atmosphere. Additionally, vegetation enhances infiltration by stabilising the soil and increasing its porosity through root systems. This process reduces surface runoff and extends the lag time. In forested basins, the presence of leaf litter and organic matter on the forest floor further aids in absorbing rainfall, slowing down its movement and facilitating infiltration. On the other hand, areas with sparse vegetation or deforested landscapes exhibit quicker runoff, shorter lag times, and higher peak discharges, making them more prone to flooding. Therefore, the type, density, and distribution of vegetation within a drainage basin are key factors in determining the hydrological response as depicted in a hydrograph.
Recession curves, which represent the return to base flow conditions after a peak discharge, are vital in hydrology for several reasons. Firstly, they provide insights into the drainage basin's ability to store water and the rate at which this stored water contributes to river flow. A gradual recession curve indicates a significant contribution from groundwater and a high capacity for water storage within the basin, which is crucial for maintaining river flows during dry periods. Secondly, the shape of the recession curve can reveal information about the permeability and porosity of the underlying geology. For instance, a steep recession curve might suggest impermeable rock, leading to rapid runoff and minimal groundwater recharge. Lastly, understanding recession curves is essential for managing water resources, particularly in predicting the availability of water for various uses such as agriculture, industry, and domestic consumption. In the context of climate change and increasing variability in precipitation patterns, accurately interpreting recession curves becomes even more critical for sustainable water management.
The type of precipitation has a significant influence on the shape of a storm hydrograph. Convective rainfall, often intense and of short duration, typically leads to a steep rising limb and a high peak discharge. This is because convective storms dump large amounts of water in a short time, overwhelming the drainage basin's ability to absorb and process the water, leading to rapid surface runoff. On the other hand, frontal rainfall, which is usually prolonged and less intense, results in a more gradual rising limb and lower peak discharge. The extended duration of frontal rainfall allows for more infiltration, reduced surface runoff, and a more moderated response in the river discharge. Orographic rainfall, occurring when moist air is forced to rise over a mountain, can also create distinct hydrograph patterns, often with a prolonged rising limb due to the sustained nature of the precipitation. Each precipitation type interacts differently with the basin's characteristics, like soil type and land use, further modifying the hydrograph's shape.
Human activities beyond urbanisation can profoundly impact hydrograph characteristics. Agriculture, for instance, changes land cover and soil properties, influencing infiltration and runoff. Intensive farming often leads to soil compaction, reducing infiltration and increasing surface runoff, which can result in a steeper rising limb and higher peak discharge on the hydrograph. Conversely, conservation agriculture practices like contour ploughing can enhance water absorption and reduce runoff. Deforestation, another significant human activity, drastically reduces interception and evapotranspiration, leading to increased runoff and a higher peak discharge. Moreover, river channelisation, a common practice to control or direct river flow for various purposes, can alter the river's response to rainfall. By straightening and deepening river channels, the time taken for water to travel downstream is reduced, potentially leading to a shorter lag time and altered peak discharge. Dams and reservoirs significantly alter hydrographs as well. By regulating river flow, they can drastically reduce peak discharges and modify the overall shape of the hydrograph. In essence, human activities have a multifaceted impact on hydrographs, affecting every aspect from the speed of runoff to the river's ability to cope with varying water volumes. Understanding these impacts is key in managing water resources and mitigating flood risks in the context of human-altered landscapes.
Practice Questions
Peak discharge and lag time are crucial components of a storm hydrograph, providing insights into the flood risk and response time of a drainage basin to precipitation. Peak discharge indicates the maximum rate of water flow following a storm, reflecting the basin's capacity to handle large volumes of water. A higher peak discharge often suggests a greater risk of flooding. Lag time, the interval between the peak rainfall and peak discharge, is indicative of the basin's response speed to rainfall. Urbanisation significantly impacts these components. It introduces impermeable surfaces like concrete, which reduce infiltration and increase surface runoff, leading to a higher peak discharge and a shorter lag time. This alteration exacerbates flood risks, as the urban drainage system is more quickly overwhelmed, and the basin's natural ability to mitigate floodwaters is diminished.
The shape of a drainage basin plays a pivotal role in determining the characteristics of its hydrograph. A circular basin, where distances from the outer edge to the river are relatively uniform, tends to have a shorter lag time and a higher peak discharge. This uniformity allows water to reach the river simultaneously, leading to a rapid increase in water level and flow rate. In contrast, an elongated basin exhibits a longer lag time and a lower peak discharge, as water from different parts of the basin takes varying amounts of time to reach the river. This results in a more gradual increase in river discharge, reducing the risk of abrupt flooding. Additionally, the steepness of the basin's slopes can influence the velocity of water flow, with steeper slopes leading to quicker runoff and potentially higher peak discharges. Understanding these nuances is crucial for effective river management and flood prevention strategies.
