
Consumer choice theory is integral in economics, providing insights into how individuals make decisions about spending their resources. This section explores the concepts of indifference curves and budget lines, shedding light on their importance, graphical representation, and interpretation within the context of consumer choice.
Understanding Indifference Curves
Definition and Characteristics
Indifference curves graphically represent combinations of two goods that offer the same level of satisfaction to a consumer.
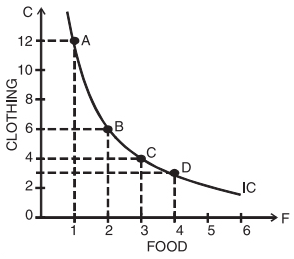
A graph illustrating the downward sloping indifference curve which is convex to the origin.
Image courtesy of toppr
Their primary characteristics are as follows:
- Downward Sloping: This reflects the trade-off between goods. As the quantity of one good increases, the quantity of the other must decrease to maintain the same satisfaction level.
- Convex to the Origin: This shape suggests a diminishing marginal rate of substitution, indicating consumers' willingness to forego increasingly smaller amounts of one good to obtain more of another as they consume more of it.
- Non-Intersecting: Each curve corresponds to a different level of utility, and thus they cannot cross each other as this would imply contradictory levels of satisfaction.
Utility and Marginal Rate of Substitution
- Utility: This concept represents the level of satisfaction or happiness a consumer derives from consuming a combination of goods. Higher indifference curves imply greater utility.
- Marginal Rate of Substitution (MRS): Defined as the rate at which a consumer is willing to give up one good in exchange for another while maintaining the same level of utility. It is the slope of the indifference curve at any point.
Budget Lines
Concept of a Budget Constraint
The budget line represents all the combinations of two goods that a consumer can purchase given their income and the prices of these goods. The equation of the budget line is as follows:
PxX + PyY = I
Here are Px and Py the prices of goods X and Y, respectively, and I represents the consumer's income.
Characteristics and Interpretation
- Slope: The slope of the budget line indicates the relative price of the two goods (the rate at which one can be exchanged for the other in the market).
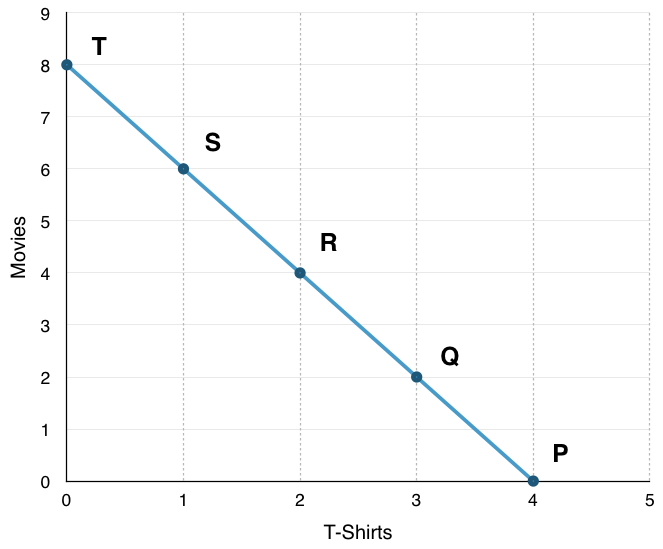
A graph illustrating the budget line.
Image courtesy of bccampus
- Shifts in the Budget Line: The position of the budget line changes with variations in income or the prices of goods. An increase in income or a decrease in the price of either good causes the budget line to shift outwards, allowing a consumer to afford a higher combination of goods.
Interaction Between Indifference Curves and Budget Lines
Consumer Equilibrium
Consumer equilibrium is the point where the budget line is tangent to an indifference curve. At this point, the consumer achieves the highest possible satisfaction within their budget constraints.
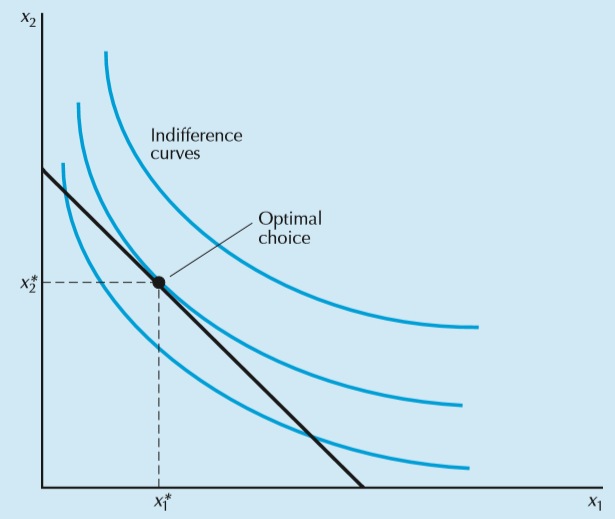
A graph illustrating the optimal bundle for utility maximisation.
Image courtesy of stackexchange
Interpretation of Tangency Point
- Tangency Point: At this point, the slope of the budget line (reflecting the price ratio of the two goods) is equal to the MRS.
- Optimal Consumption Bundle: The tangency point indicates the optimal combination of goods that the consumer can afford, maximizing their utility.
Graphical Analysis
Plotting and Interpreting Graphs
- Graphical representations typically place one good on each axis.
- Indifference curves are plotted based on hypothetical consumer preferences.
- The budget line is drawn considering the consumer's income and the prices of the goods.
Examples and Scenarios
- Normal Goods: For these goods, an increase in income typically results in the consumer moving to a higher indifference curve due to the outward shift of the budget line, indicating higher consumption.
- Inferior Goods: For inferior goods, an increase in income might lead to a decrease in consumption, as consumers prefer more desirable substitutes.
Applications in Real-World Scenarios
Decision Making and Policy Implications
- These concepts are vital for businesses in strategizing product pricing and marketing.
- Policymakers use these theories to anticipate the effects of economic policies on consumer choices and market demand.
Limitations of Indifference Curve Analysis
Despite their usefulness, indifference curves have limitations:
- Subjectivity of Utility: Utility is a subjective concept and cannot be directly measured or observed.
- Assumption of Rationality: The model assumes consumers are rational and possess perfect information, which may not align with real-world scenarios.
Detailed Examination of Indifference Curves
Shape and Implications
- The convex shape towards the origin reflects the principle of diminishing marginal utility. As a consumer has more of one good, their willingness to substitute it for another decreases.
Different Types of Indifference Curves
- Perfect Substitutes: Straight-line indifference curves, indicating constant MRS.
- Perfect Complements: Right-angle indifference curves, showing fixed consumption ratios.

Image courtesy of slideplayer
- Goods with Saturation Points: Indifference curves that flatten at certain points, indicating saturation.
Comprehensive Look at Budget Lines
Factors Influencing the Budget Line
- Income Changes: An increase in income shifts the budget line outward, allowing access to higher indifference curves.
- Price Changes: A decrease in the price of one good pivots the budget line outward from that axis, increasing the affordable quantity of that good.
Real-World Examples
- Price changes due to inflation or discounts can significantly alter consumer choices, as depicted by shifts in the budget line.
Conclusion
Indifference curves and budget lines provide a foundational framework in consumer choice theory. They offer a simplified yet powerful way to analyze and predict consumer behavior under various economic conditions. While acknowledging their limitations, these concepts remain essential in both theoretical and practical applications in economics.
FAQ
The convex shape of indifference curves towards the origin is significant in consumer choice theory as it represents the principle of diminishing marginal rate of substitution (MRS). This shape indicates that as a consumer increases consumption of one good, they are willing to give up decreasing amounts of the other good to maintain the same level of utility. Essentially, the more of one good a consumer has, the less they are willing to substitute it for the other good, reflecting diminishing marginal utility. This convexity is a realistic representation of most consumers' preferences, highlighting the concept that the first few units of a good provide more utility than subsequent units. The shape of the curves is crucial for determining the optimal consumption bundle at the point of tangency with the budget line, where the MRS is equal to the price ratio of the two goods, leading to an equilibrium that maximises the consumer's utility given their budget constraint.
Indifference curves cannot intersect, and if they do, it implies an inconsistency in consumer preferences. Each curve represents a different level of utility, and intersections would suggest that the same combination of goods provides different levels of utility, which is logically impossible. If two curves intersect, it contradicts the assumption that more is preferred to less because at the intersection point, the consumer is indifferent between two different levels of consumption, which should not be the case. For a set of preferences to be consistent and to adhere to the assumption of transitivity (if a consumer prefers A to B and B to C, then they must prefer A to C), indifference curves must be distinct and non-intersecting. Such a scenario where indifference curves intersect would imply irrational consumer behaviour, which is not a typical assumption in standard consumer choice theory.
Introducing a new good into a consumer's choice set can significantly alter their indifference curves and budget line. Firstly, indifference curves may change shape or position, as preferences adjust to incorporate the new good. For instance, if the new good is a close substitute for an existing one, the curves might become less steep, reflecting a higher willingness to substitute between the goods. Regarding the budget line, the introduction of a new good, assuming it has a different price, changes the consumer's spending allocation. If the new good is more expensive, it could lead to a pivot in the budget line, decreasing the affordable quantity of other goods. However, if it's cheaper or offers better utility for the same price, consumers might allocate more of their budget to it, altering their optimal consumption bundle. This change in the budget line and indifference curves highlights the dynamic nature of consumer preferences and the importance of product pricing and utility in consumer choice theory.
Changes in the prices of goods have a direct impact on the budget line, illustrating how consumer choices are influenced by price fluctuations. A decrease in the price of a good pivots the budget line outward from that axis, allowing the consumer to afford more of that good or a different combination of goods for the same level of income. Conversely, an increase in the price of a good pivots the budget line inward, reducing the quantity of the good that the consumer can afford. These shifts in the budget line due to price changes demonstrate the price effect in consumer choice theory. It shows how consumers reallocate their spending between different goods in response to price changes, moving to a different equilibrium point where the budget line is tangent to a new indifference curve. This adjustment reflects the substitution effect (switching from a more expensive to a cheaper good) and the income effect (change in purchasing power due to price changes), both of which are integral in understanding how price variations influence consumer decision-making.
Indifference curves and budget lines are powerful tools in understanding real-world consumer behavior. They provide a graphical representation of consumer preferences and constraints, enabling an analysis of how consumers make choices between different goods. By illustrating the concept of trade-offs and budget constraints, these tools help in predicting how changes in income, prices, and consumer preferences impact buying decisions. For instance, they can show how a consumer might react to a price increase in a favorite product – whether they'll consume less of it, switch to a substitute, or maintain consumption by reducing the purchase of other goods. Moreover, these concepts are vital in market research and policy-making, helping businesses and governments understand consumer response to pricing strategies, income changes, and economic policies. While they are simplifications of the complex nature of human preferences, indifference curves and budget lines provide a foundational framework for analyzing and anticipating consumer behavior in a structured and logical manner.
Practice Questions
An increase in a consumer's income, assuming constant prices, results in an outward shift of the budget line. This shift allows the consumer to afford more combinations of goods. The new budget line touches a higher indifference curve, indicating a higher level of satisfaction or utility. The consumer moves to a more preferred position where they can purchase a greater quantity of both goods or a different combination of the two, depending on their preferences. This change demonstrates the income effect in consumer choice theory, where higher income increases purchasing power, enabling consumers to achieve higher utility levels.
The Marginal Rate of Substitution (MRS) is the rate at which a consumer is willing to substitute one good for another while maintaining the same level of satisfaction or utility. It is crucial in determining the shape of indifference curves. The diminishing MRS, which is common in most consumer preferences, leads to the convex shape of indifference curves to the origin. This convexity reflects the principle of diminishing marginal utility, where as a consumer has more of one good, their willingness to give up that good for another decreases. This concept is essential for understanding consumer equilibrium, as the MRS at the point of tangency with the budget line determines the optimal combination of goods for the consumer.
