
Elasticity calculations in economics provide insightful quantitative analysis about how sensitive the demand for a product is to changes in various economic factors. This section delves into three primary types of demand elasticity: Price Elasticity of Demand (PED), Income Elasticity of Demand (YED), and Cross Elasticity of Demand (XED).
1. Price Elasticity of Demand (PED)
Definition
Price Elasticity of Demand quantifies the responsiveness of the quantity demanded of a good to a change in its price. It's essential for understanding consumer behaviour and for making informed pricing decisions.
Formula: PED = (Percentage Change in Quantity Demanded) / (Percentage Change in Price)
Calculation Method
- 1. Determine the Initial and Final Prices and Quantities: Identify the starting and ending points for price and quantity.
- 2. Calculate the Percentage Changes: Use the formula [(New Value - Original Value) / Original Value] × 100% for both price and quantity.
- 3. Divide the Percentage Changes: The percentage change in quantity demanded is divided by the percentage change in price to get PED.
Example
Consider a situation where the price of a notebook falls from £5 to £4, and as a result, the quantity demanded increases from 200 to 250 units. To calculate PED:
- Percentage Change in Quantity Demanded: [(250 - 200) / 200] × 100% = 25%
- Percentage Change in Price: [(4 - 5) / 5] × 100% = -20%
- PED = 25% / -20% = -1.25
The negative value signifies the inverse relationship typically seen in demand and price changes. A PED greater than 1 (in absolute value) indicates high price sensitivity, suggesting the good is elastic.
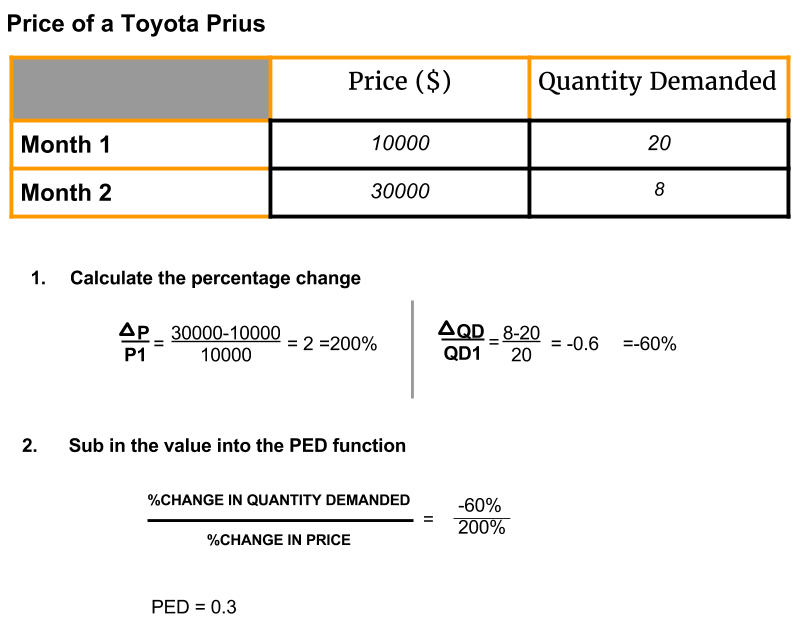
Image courtesy of adarshibeconomics
2. Income Elasticity of Demand (YED)
Definition
Income Elasticity of Demand measures the change in the quantity demanded of a good in response to a change in consumers' income. It's vital for predicting changes in demand patterns as economic conditions fluctuate.
Formula: YED = (Percentage Change in Quantity Demanded) / (Percentage Change in Income)
Calculation Method
- 1. Identify Income Changes and Demand Changes: Note the initial and final values of consumer income and the quantity demanded.
- 2. Calculate the Percentage Changes: Use the same formula as in PED for both income and quantity demanded.
- 3. Divide the Percentage Changes: The percentage change in quantity demanded is divided by the percentage change in income to find YED.
Example
Imagine a consumer's income increases from £20,000 to £25,000, and their demand for high-quality headphones increases from 2 pairs to 3 pairs annually. The calculation is:
- Percentage Change in Quantity Demanded: [(3 - 2) / 2] × 100% = 50%
- Percentage Change in Income: [(25,000 - 20,000) / 20,000] × 100% = 25%
- YED = 50% / 25% = 2
A YED greater than 1 signifies that the product is a luxury good, where demand increases more than proportionally as income increases.
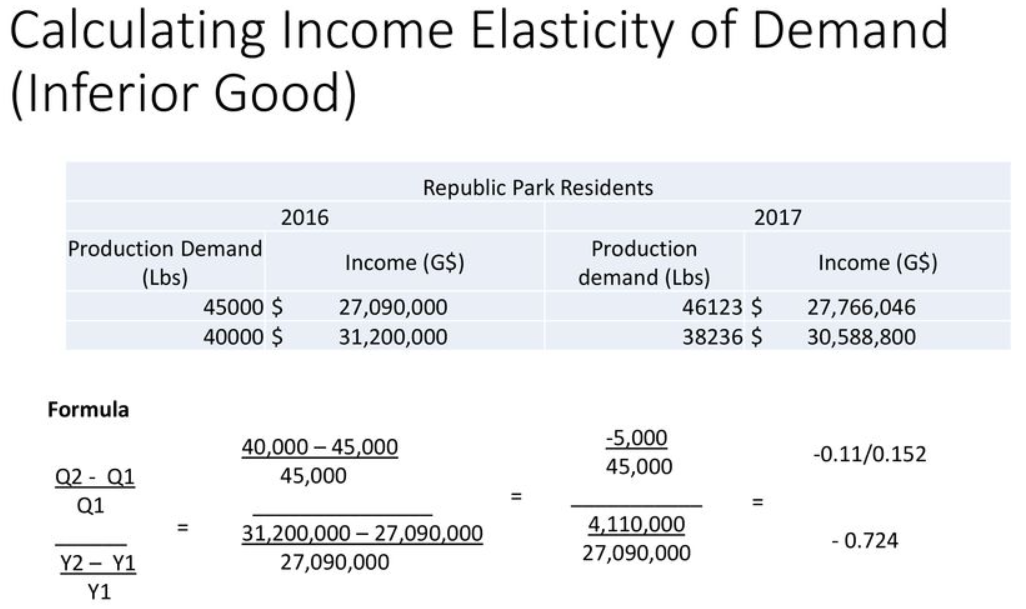
Image courtesy of slideplayer
3. Cross Elasticity of Demand (XED)
Definition
Cross Elasticity of Demand gauges how the quantity demanded of one good responds to a change in the price of another related good. It's crucial for understanding the interplay between complementary and substitute goods in the market.
Formula: XED = (Percentage Change in Quantity Demanded of Good A) / (Percentage Change in Price of Good B)
Calculation Method
- 1. Identify Price Change in One Good and Demand Change in Another: Note the changes in price for one good and the corresponding changes in demand for the related good.
- 2. Calculate the Percentage Changes: Apply the standard percentage change formula.
- 3. Divide the Percentage Changes: The percentage change in quantity demanded of Good A is divided by the percentage change in price of Good B.
Example
If the price of petrol increases by 20% and the demand for electric cars increases by 10%, the XED calculation would be:
- Percentage Change in Quantity Demanded of Electric Cars: 10%
- Percentage Change in Price of Petrol: 20%
- XED = 10% / 20% = 0.5
A positive XED indicates that the goods are substitutes. A higher positive value would indicate stronger substitutability.
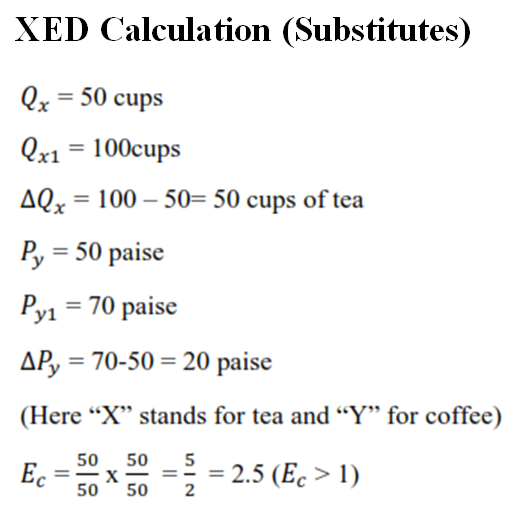
Image courtesy of simplynotes
Exercises for Practical Application
- 1. PED Calculation Exercise: If a coffee shop increases the price of a latte from £2.50 to £3.00 and sees a decrease in demand from 400 to 350 cups per day, calculate the PED.
- 2. YED Calculation Exercise: When a person's income increases from £40,000 to £50,000, and their consumption of gourmet food increases from 10 meals to 15 meals a month, determine the YED.
- 3. XED Calculation Exercise: Calculate the XED for smartphones if the price of mobile data plans decreases by 15% and the demand for smartphones increases by 5%.
These exercises are designed to solidify understanding and practical application of elasticity concepts, providing a foundation for deeper analysis of market dynamics and consumer behaviour.
FAQ
Cross elasticity of demand (XED) can be a vital tool in identifying market structures and informing competitive strategies. By measuring how the demand for a product changes in response to a price change in another product, XED helps in identifying whether goods are substitutes or complements. For instance, a high positive XED indicates strong substitutes, often characteristic of a competitive market where many similar products are available. Conversely, a low or negative XED suggests complementarity, typical in markets with complementary goods or services. Businesses can use this information to understand their competitive landscape. For example, if a company finds that its product has a high XED with another company's product, it may indicate intense competition, necessitating strategies like differentiation or competitive pricing. Additionally, understanding XED helps in anticipating the impact of competitors' price changes on one's own product, aiding in strategic planning and market positioning. Thus, XED is not only a measure of consumer behaviour but also a strategic tool for understanding market dynamics.
The elasticity of demand is significantly influenced by factors such as the availability of substitutes and the time period considered. The presence of close substitutes makes demand more elastic. If a product has many substitutes, consumers can easily switch to alternative products when the price of the original product increases, leading to a higher price elasticity of demand. For instance, the demand for a specific brand of cereal is likely to be elastic because there are numerous other cereal brands and types available.
The time period also plays a crucial role. In the short term, demand is often inelastic because consumers and producers need time to adjust to price changes. Over time, as consumers find substitutes or adjust their consumption habits, demand becomes more elastic. For example, the demand for fuel may be inelastic in the short term, as people can't immediately change their driving habits or vehicles. However, in the long term, as people find alternative modes of transportation or switch to more fuel-efficient cars, the demand becomes more elastic. These factors are essential for businesses and policymakers to consider when making pricing decisions and forecasting the effects of price changes on demand.
Income elasticity of demand (YED) is a valuable tool for forecasting market trends and consumer behaviour during economic fluctuations. YED measures how the demand for a product changes as consumer income changes. Products with a high positive YED are considered luxury goods, meaning their demand increases more than proportionally as income rises. Conversely, goods with a low or negative YED (like basic necessities) see less variation in demand with changes in income. During economic booms, consumers have more disposable income, leading to increased demand for luxury goods. In contrast, during recessions, the demand for these goods typically falls more sharply than the demand for necessities. Understanding YED allows businesses and economists to predict changes in consumer spending patterns based on economic conditions. For example, luxury car manufacturers might expect a decrease in sales during economic downturns but an increase during times of economic growth. Similarly, retailers can adjust their product offerings and marketing strategies based on the anticipated income elasticity of their products. This understanding aids in strategic planning, inventory management, and risk assessment.
Elasticity is crucial for businesses considering price discrimination strategies because it helps them understand how different segments of the market react to price changes. Price discrimination involves charging different prices to different groups of consumers for the same product. This strategy can only be effective if the demand elasticity varies across these groups. For instance, a business might charge a higher price to a group with inelastic demand (less sensitive to price changes) and a lower price to a group with elastic demand (more sensitive to price changes). By understanding elasticity, businesses can maximise their total revenue and profit. For example, in the case of airline tickets, business travellers often exhibit inelastic demand due to their specific travel needs, while leisure travellers exhibit more elastic demand. Airlines use this knowledge to set higher prices for last-minute bookings (typically made by business travellers) and lower prices for advance bookings. Thus, elasticity analysis is fundamental in implementing effective and profitable price discrimination strategies.
Arc elasticity is a method used to calculate the elasticity of demand (or supply) over a range of prices, rather than at a single point. This approach is particularly useful when dealing with large price changes. Arc elasticity calculates the average elasticity between two points on the demand curve, using the midpoint formula for percentage changes. It provides a more general view of elasticity over a range, as it doesn't assume linearity of the demand curve. In contrast, point elasticity measures elasticity at a specific point on the curve, assuming infinitesimally small changes in price. It's more precise for small price changes but can be less accurate for larger changes. Point elasticity is often used in theoretical analysis, while arc elasticity is more practical for real-world applications where price changes are not infinitesimally small. Both methods are important for understanding how responsive the demand for a product is to price changes, but they are used in different contexts depending on the nature and scale of the price change being analysed.
Practice Questions
The Price Elasticity of Demand (PED) for the smartphone is calculated as follows: The percentage change in quantity demanded is (1,200 - 1,000) / 1,000 × 100% = 20%. The percentage change in price is -15% (since it's a decrease). Therefore, PED = 20% / -15% = -1.33. This result indicates that the demand for the smartphone is elastic, meaning consumers are relatively sensitive to price changes. A 15% decrease in price leads to a more than proportional 20% increase in quantity demanded, reflecting high responsiveness of consumers to price changes in this market.
The Income Elasticity of Demand (YED) for organic food products is calculated as follows: The percentage change in quantity demanded is 25%, and the percentage change in income is 10%. Therefore, YED = 25% / 10% = 2.5. This result indicates that organic food products are a luxury good, as the YED is greater than 1. It suggests that as consumer income increases, the demand for organic foods increases more than proportionally. This highlights that consumers are likely to spend a larger proportion of their additional income on organic foods, reflecting their preference for higher quality or healthier options as their purchasing power increases.
