
The Production Possibility Curve (PPC) is an essential concept in A-Level Economics, depicting an economy's potential production capacity under the constraints of scarcity.
Introduction to PPC
The Production Possibility Curve (PPC) is a graphical representation that demonstrates the maximum possible output of two goods or services an economy can produce using its available resources and technology, under the assumption of efficiency. The curve is a vital tool in economics for understanding the interplay of opportunity cost, resource allocation, and production efficiency.
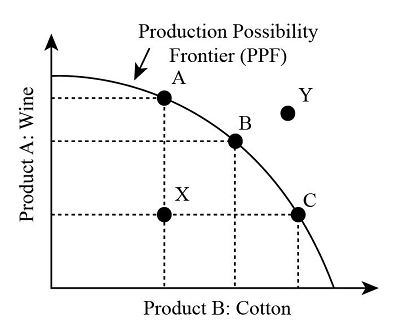
Image courtesy of study
Understanding Scarcity, Choices, and Trade-offs
At the heart of the PPC lies the concept of scarcity and the resulting need for choices and trade-offs.
- Scarcity: In economics, scarcity refers to the fundamental problem of having seemingly unlimited human wants in a world of limited resources. The PPC graphically represents this limitation, indicating the maximum productive capabilities of an economy given its resources.
- Choices: Due to scarcity, an economy must make decisions about how to allocate its finite resources between different goods and services. The PPC visually demonstrates these choices by showing various combinations of two goods or services that an economy can produce.
- Trade-offs: Opting for more of one good usually means sacrificing the production of another, due to the limited resources. The PPC’s slope embodies this trade-off, illustrating the rate at which one good must be foregone for another. This slope is a graphical representation of the opportunity cost.
Analytical Tools for Interpreting PPCs
A thorough understanding of PPCs requires familiarity with several key economic concepts.
- Opportunity Cost: It is defined as the value of the next best alternative that is not chosen. On the PPC, this is depicted by the gradient of the curve. A steeper gradient indicates a higher opportunity cost for one good relative to another.
- Efficiency: Points on the PPC represent efficient production, where the economy utilises its resources to the fullest. Points inside the curve indicate underutilisation of resources, while points outside are currently unattainable.
- Marginal Analysis: This involves assessing the additional benefits and costs incurred by producing marginally more or less of a good. It aids in identifying the optimal production point on the PPC.
Practical Implications of PPC
To contextualise these concepts, consider an economy that only produces wheat and cars. The PPC would illustrate the maximum combinations of these two goods that can be produced with the given resources. Moving along the curve from more wheat to more cars illustrates the opportunity cost in terms of wheat foregone. This example simplifies complex economic decisions into a comprehensible model.
PPC and Economic Growth
Economic growth can be visualised on a PPC as an outward shift of the curve. This shift can occur due to factors like technological advancements, increases in resources, or improvements in the quality of existing resources. Such growth expands an economy’s productive capabilities, allowing it to produce more of both goods without incurring higher opportunity costs.
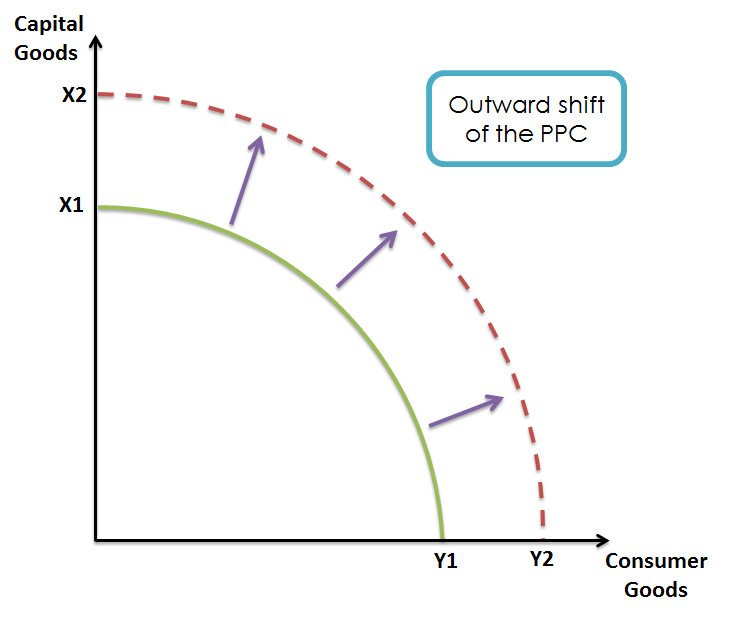
Image courtesy of toppr
Resource Allocation and Economic Policy
The PPC also has implications for economic policy and resource allocation. Policymakers use it to determine the most efficient allocation of resources to achieve desired economic outcomes. For instance, deciding between investing in healthcare or education can be analysed through the lens of PPC, evaluating the opportunity costs and benefits of each choice.
PPC and Real-World Scenarios
In real-world scenarios, the PPC can be applied to various economic situations. For example, during a recession, an economy might operate inside the PPC, indicating underutilisation of resources. Conversely, during a boom, the economy might be operating at a point on the curve, indicating efficient utilisation.
In conclusion, the Production Possibility Curve is more than just a theoretical concept; it's a practical tool used in economics to visualise and analyse the trade-offs, choices, and implications of resource allocation in the face of scarcity. Its application extends from classroom learning to real-world economic policy and decision-making, making it a cornerstone of economic understanding for A-Level students.
FAQ
Technological advancements can significantly impact the PPC by causing an outward shift. This shift represents an increase in an economy's production capacity without needing more resources. For example, if a new technology allows for more efficient production of goods, the same amount of resources can produce more output, shifting the PPC outward. This can happen in one or both industries represented on the PPC. If technology improves more in one industry than the other, the curve might shift out more for the good with the greater technological improvement. This shift is a graphical representation of economic growth driven by technological progress.
Economic efficiency in relation to the PPC refers to an economy's ability to maximise the production of goods and services given its available resources. On the PPC, points that lie on the curve represent productive efficiency, where an economy is producing the maximum possible output of one good without reducing the output of another. Any point inside the curve indicates inefficiency, as more of one or both goods could be produced with the available resources. Points outside the curve are unattainable with current resources. Therefore, the PPC not only illustrates potential production combinations but also indicates the efficiency or inefficiency of resource use in an economy.
Human capital, comprising the skills, knowledge, and experience possessed by individuals, plays a crucial role in shaping the PPC. An increase in human capital, through education and training, enhances the productivity of the workforce. This improvement in productivity can lead to an outward shift of the PPC, indicating that the economy can produce more goods and services with the same amount of physical resources. For instance, a more educated and skilled workforce can utilise resources more efficiently, leading to higher output. Furthermore, human capital can also influence the slope of the PPC, as improvements in specific sectors may reduce the opportunity costs associated with shifting resources between different types of production.
Yes, a PPC can be linear, although it's less common. A linear PPC indicates constant opportunity costs for the production of two goods. This implies that the resources are equally efficient in producing both goods, and reallocating resources from one good to another doesn't change the production efficiency. In reality, this scenario is rare, as resources tend to be better suited for the production of one good over another, leading to increasing opportunity costs and a concave PPC. A linear PPC is a theoretical simplification used to illustrate specific economic concepts, but it doesn't typically reflect the complexities of real-world economies.
In a perfectly competitive market, the PPC is typically concave to the origin, reflecting increasing opportunity costs. This shape arises because resources are not equally efficient in all activities; as more resources are allocated to producing one good, they become less efficient, increasing the opportunity cost. In contrast, in a monopolistic market, the PPC might not represent the actual potential of an economy. A monopolist might restrict output to maximise profits, resulting in the economy operating inside the PPC. This underutilisation of resources leads to inefficiency, unlike in a perfectly competitive market where firms produce where price equals marginal cost, leading to an efficient allocation of resources and operating on the PPC.
Practice Questions
The concept of opportunity cost in a PPC is represented by the slope of the curve. For instance, consider a PPC showing the production possibilities of wheat and cars. If the economy moves from point A to point B on the curve, producing more cars but less wheat, the opportunity cost is the amount of wheat forgone to produce the additional cars. This trade-off reflects the essence of opportunity cost: the loss of one benefit to gain another. The steeper the slope, the higher the opportunity cost of switching production from one good to another, indicating the relative scarcity of one good in terms of another.
An outward shift in the PPC indicates economic growth, expanding an economy's production potential. This shift can result from various factors, including technological advancements that increase productivity, an increase in the quantity or quality of resources, or improvements in human capital through education and training. For example, if a country develops new agricultural technologies, it can produce more crops with the same amount of resources, leading to an outward shift in the PPC. Similarly, an increase in the workforce or improvements in workforce skills can enhance the economy's capacity to produce more goods and services.
