
Straight-line graphs are a fundamental aspect of coordinate geometry, providing visual representations of linear relationships between two variables. In this section, we delve into the methods for drawing graphs of linear equations, utilising examples to illustrate key concepts. Understanding how to create and interpret these graphs is crucial for solving a variety of problems in mathematics and real-world applications.
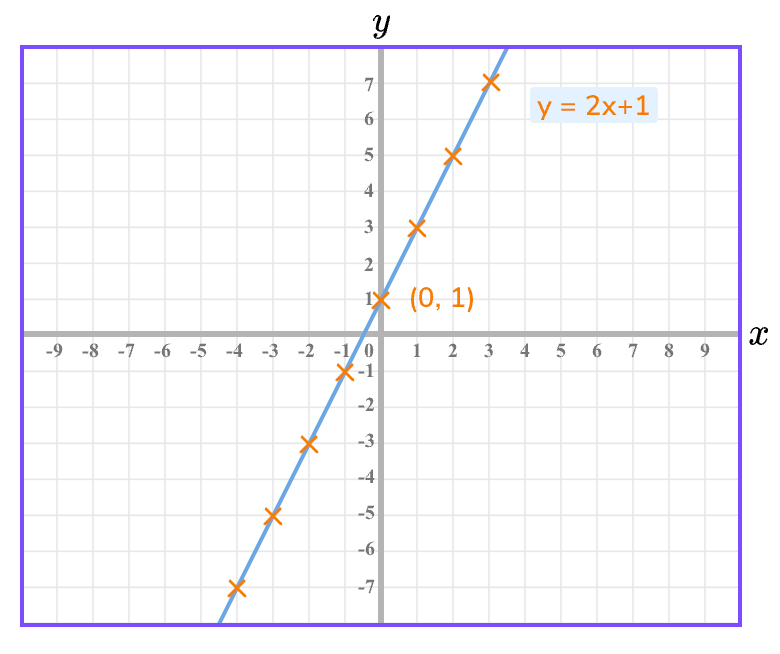
Image courtesy of Third Space Learning
Understanding Linear Equations
Linear equations form the foundation of coordinate geometry, depicting relationships where one variable changes at a constant rate with respect to another. The general form of a linear equation in two variables, x and y, is given as:
- General Form:
- Slope-Intercept Form:
Where:
- , , and are constants in the general form,
- represents the slope, indicating the steepness of the line,
- is the y-intercept, the point where the line crosses the y-axis.
Drawing Graphs of Linear Equations
To draw a graph of a linear equation, identify the slope and y-intercept. Plot the y-intercept on the y-axis, then use the slope to find another point.
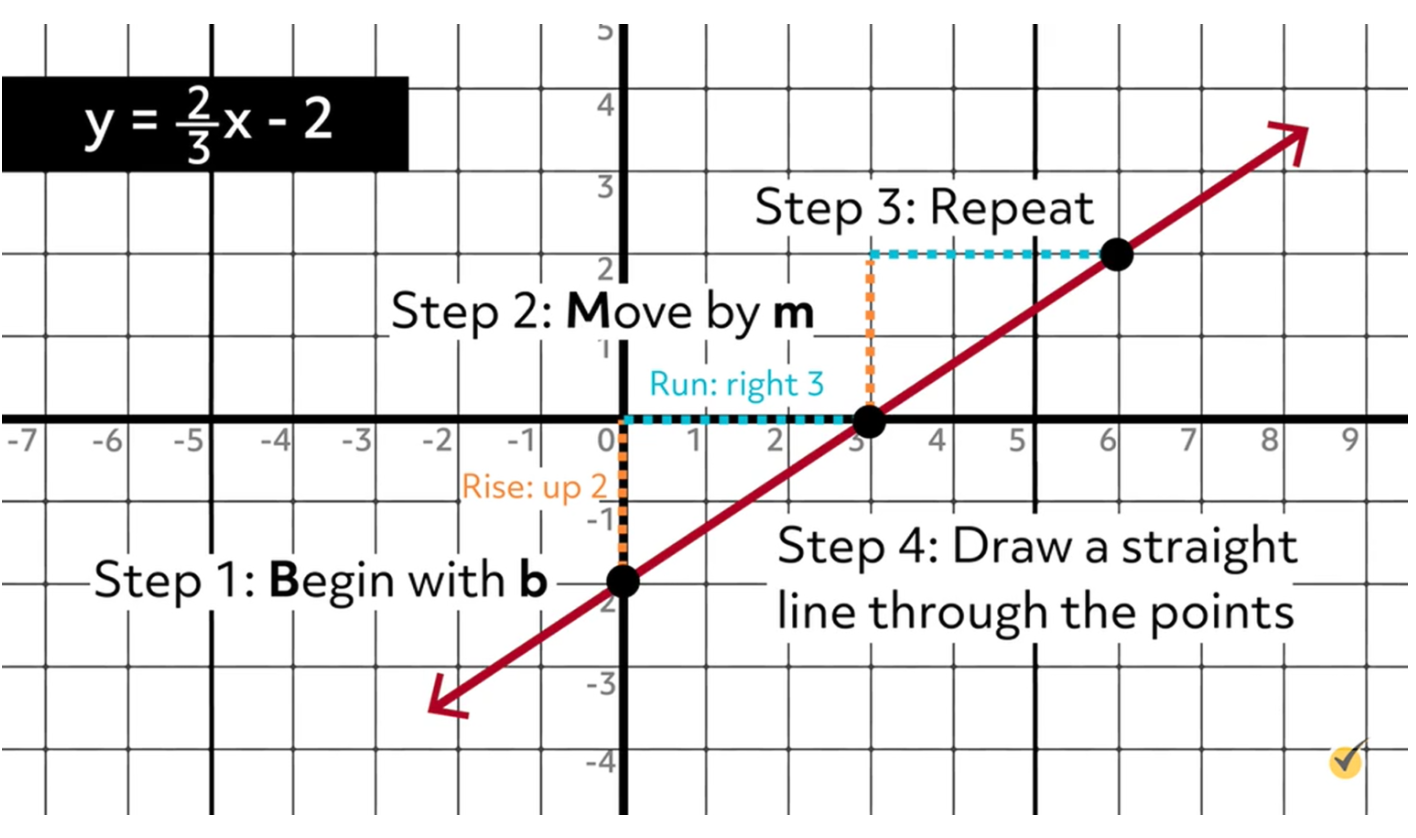
Image courtesy of Mometrix
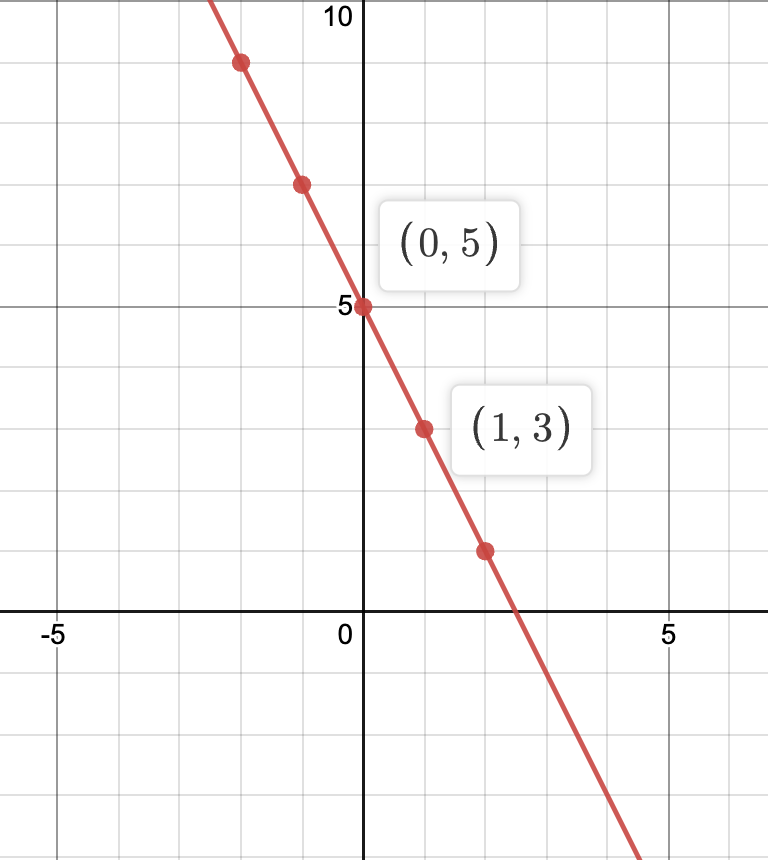
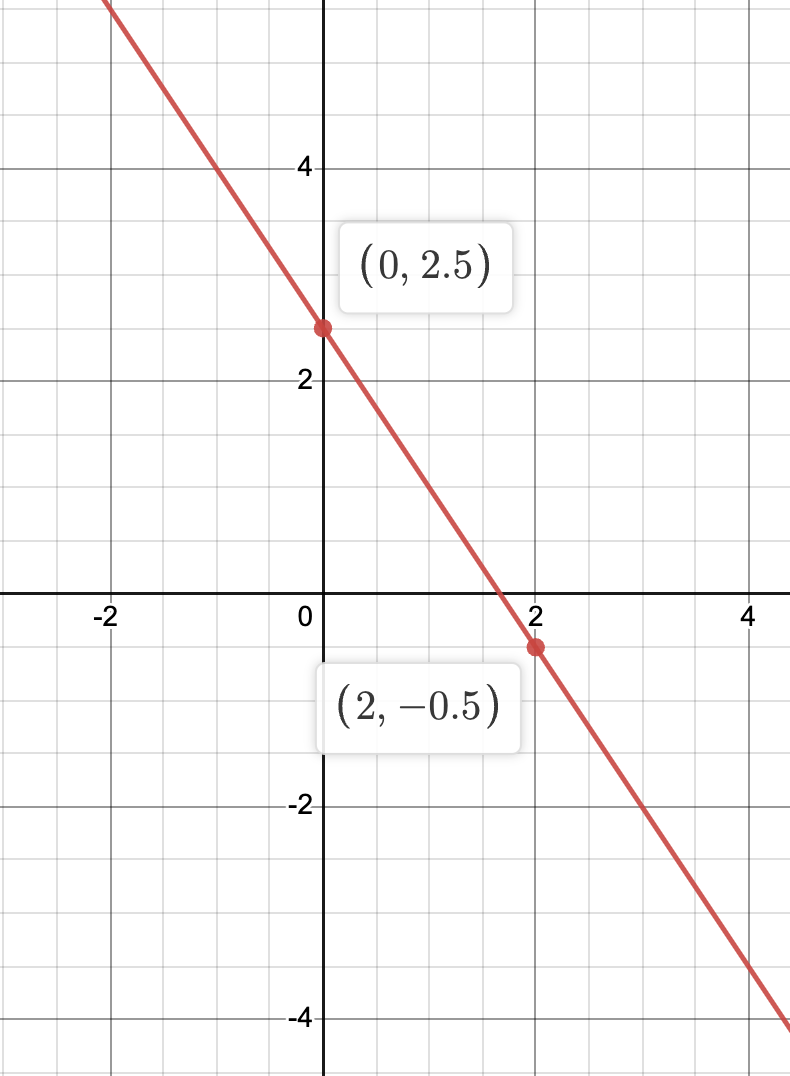
Example 1:
Draw the graph of the equation .
1. Identify the slope and y-intercept: Here, , and .
2. Plot the y-intercept on the y-axis.
3. Use the slope to find another point: from , move 2 units down (because the slope is negative) and 1 unit right. This leads to the point .
4. Draw the line connecting these points.
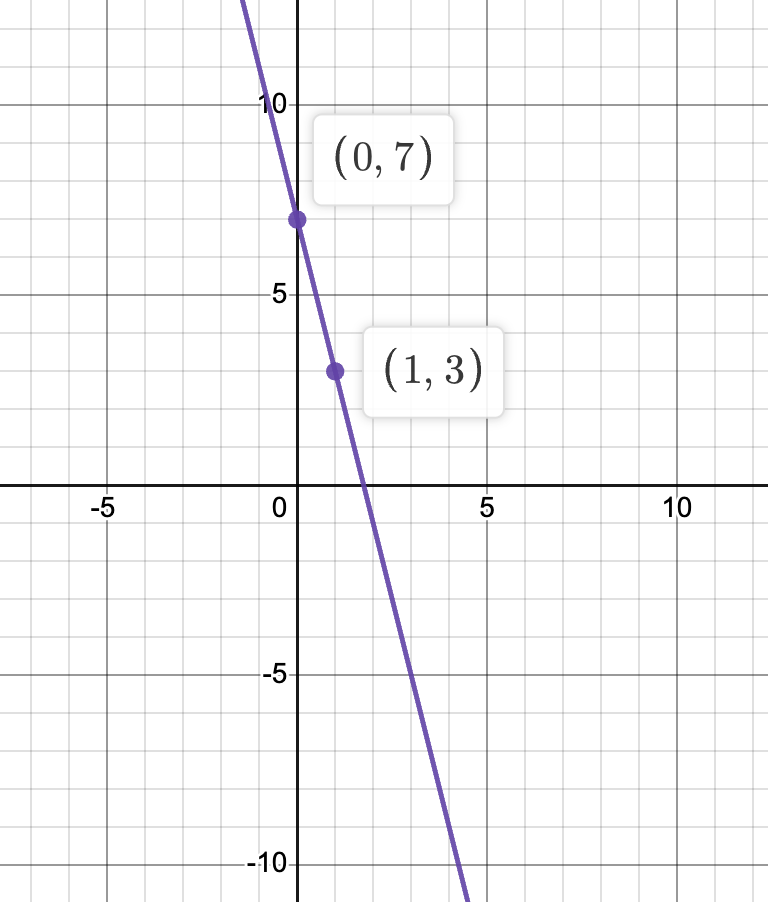
Example 2:
Graph the equation .
1. Rearrange to the form , giving .
2. Slope is -4, and y-intercept is 7.
3. Plot and use the slope to find another point: from , move 4 units down and 1 unit right, reaching .
4. Draw the line through these points.
Example 3:
Draw the graph of the equation .
1. Rearrange to form: gives .
2. Slope is , and y-intercept is .
3. Plot on the y-axis.
4. From , move 3 units down and 2 units right to find another point, leading to .
5. Connect these points to draw the line.
Key Concepts
- Slope : Indicates the direction and steepness of the line.
- Y-intercept : The point where the line crosses the y-axis.
Practical Tips
- To find additional points: Use the slope as a guide (rise over run).
- Check your graph: Plot at least 3 points to ensure accuracy.
- Use graph paper: For precision in plotting points and drawing lines.
