
In statistics, understanding and applying measures of central tendency and variation are essential for interpreting data. These measures provide insights into the general pattern of a data set and the spread of values around this pattern. This chapter focuses on the calculation and application of mean, median, and mode for central tendency, and the computation of range, interquartile range, and standard deviation for variation. Furthermore, we'll explore how to utilise these measures to compare different data sets.
Central Tendency: Mean, Median, and Mode
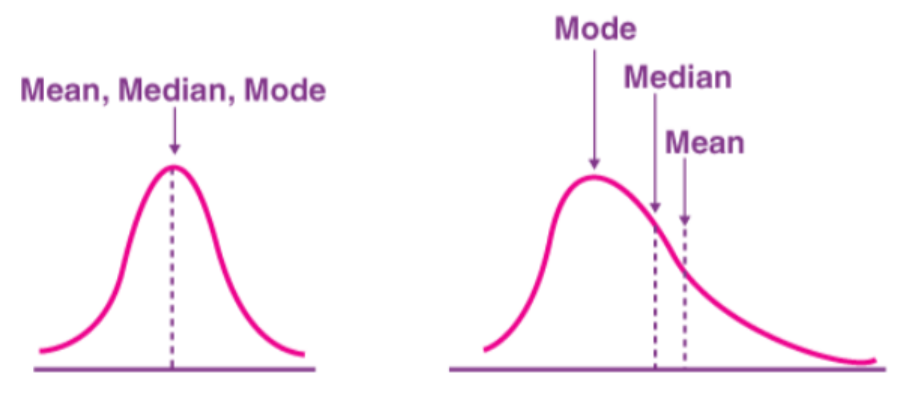
Image courtesy of Byjus
- Mean (Average): Add all values and divide by the number of values.
- Example: {4, 8, 6, 5, 3} → Mean =
- Median (Middle Value):
- Odd number of values: Middle value.
- Even number of values: Average of two middle values.
- Example: {7, 4, 2, 8, 5} → Ordered {2, 4, 5, 7, 8} → Median = 5
- Mode (Most Frequent Value): Value that appears most.
- Example: {2, 2, 3, 4, 4, 4} → Mode = 4
Variation: Range, Interquartile Range (IQR), and Standard Deviation
Range:
- Difference between highest and lowest values.
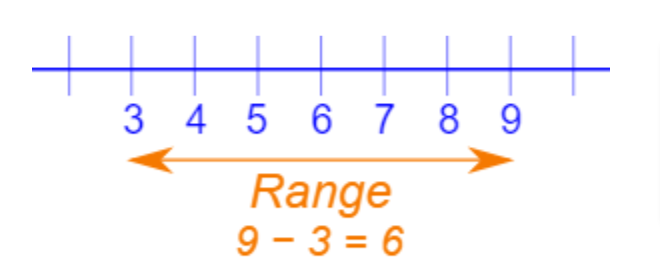
Image courtesy of Math is Fun
- Example: {5, 22, 9, 6, 13} → Range = ( 22 - 5 = 17 )
Interquartile Range (IQR):
- Difference between the upper and lower quartiles (middle 50% of data).
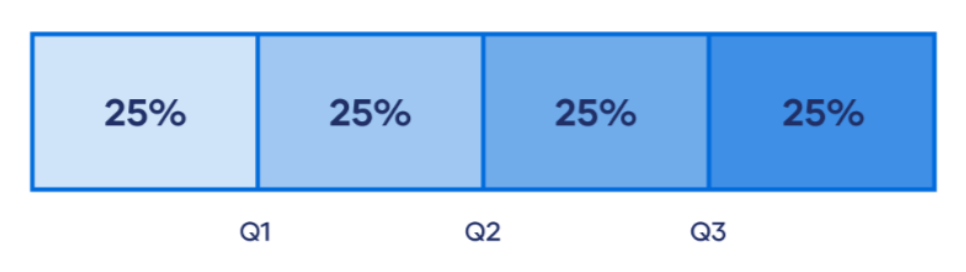
Image courtesy of scribbr
- Example: {1, 2, 4, 5, 6, 7, 8} → Q1 = 2, Q3 = 7 → IQR = ( 7 - 2 = 5 )
Standard Deviation:
- Measures how spread out numbers are from the mean.
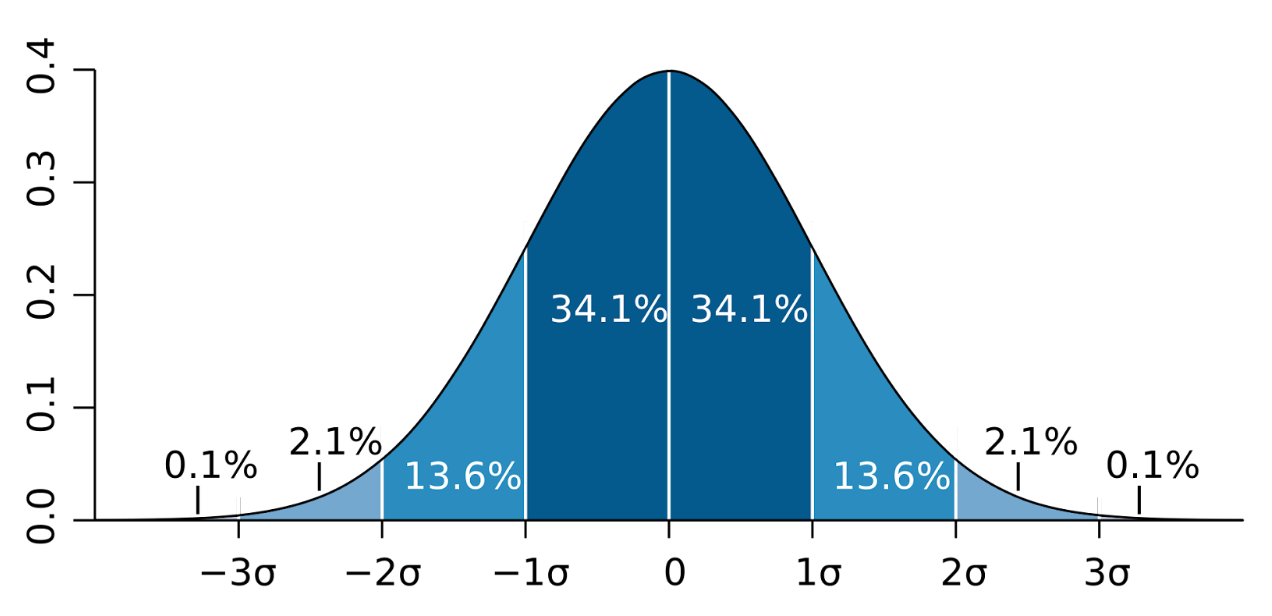
Image courtesy of wikipedia
- Example: {2, 4, 4, 4, 5, 5, 7, 9} → Mean = 5
- Calculate squared deviations from mean, sum them, divide by number of values, and take square root.
- Standard Deviation = for Set A, for Set B
Comparing Data Sets
- Two sets can have the same mean but different ranges or standard deviations, showing different spreads.
Example:
- Set A = {10, 15, 20, 25, 30}, Set B = {18, 19, 20, 21, 22}
- Both have mean of 20.
- Range: A = 20, B = 4
- Standard Deviation: A = , B =
- Conclusion: Set A has a wider spread of values than Set B.
